Hotspots don’t just annoy your thermal team—they throttle performance and burn budget. Well‑executed aisle containment stabilizes server inlet temperatures and lets you raise cooling setpoints without risk. In 10–40 kW per rack environments, you can expect tighter inlet uniformity, fewer recirculation paths, fan‑power reductions, and auditable ROI—provided you commission it with the right sensors and stay within code.
This guide shows what “effective” looks like (with metrics), when to choose cold vs. hot aisle, how to run quick ROI math you can defend, where to place sensors, and how to keep your design compliant across regions.
Key takeaways
Aisle containment effectiveness means stable server inlet temperatures within ASHRAE A1/A2 recommended ranges and ≤2–3°C variation across racks under steady load.
Peer‑reviewed and lab sources show ASE often improving into the high‑80s to low‑90s and SHI dropping toward ~0.1 in optimized hot‑aisle designs, indicating strong isolation. See the 2024 Frontiers study and LBNL guidance for context.
Quick ROI is achievable: cooling energy savings in the 20–35% range are commonly reported for well‑executed containment, with multiple ENERGY STAR case examples showing sub‑1‑year payback when setpoints are raised with adequate sensing.
Start with cold‑aisle containment (CAC) for retrofits; prefer hot‑aisle containment (HAC) in greenfield with integrated ceiling returns and suppression planning.
Commissioning hinges on sensor placement: measure at server inlets (top/mid/bottom), add aisle and CRAH points, then validate uniformity before raising setpoints.
Code compliance is achievable without drama: maintain clear egress widths, coordinate detection/suppression with the AHJ, and document assumptions.
Aisle containment effectiveness: what it looks like and how to measure it
Containment works by preventing the mixing of supply and return air, reducing recirculation and bypass. The result is more stable server inlet temperatures and better use of cooling capacity. Two airflow effectiveness metrics help quantify this:
Air Supply Efficiency (ASE): the percentage of supplied air that reaches IT intakes. Containment can lift ASE from the mid‑60s/low‑70s into the high‑80s or low‑90s in many layouts, according to a peer‑reviewed analysis in 2024. See the discussion in the Frontiers in Built Environment paper on airflow optimization and ASE/SHI outcomes: ASE rises into the low‑90s with optimized containment.
Supply Heat Index (SHI): the fraction of return heat mixing back into the supply. Lower is better; optimized hot‑aisle designs in literature trend toward ~0.1 under idealized conditions (same study as above).
Evidence‑backed practice for temperatures:
ASHRAE‑aligned recommendations target server inlet 18–27°C (64.4–80.6°F) for typical classes A1/A2. Lawrence Berkeley National Laboratory compiled ranges and measurement notes in a 2020 guidance deck: LBNL’s temperature measurement overview.
Field studies report noticeably tighter inlet uniformity after containment. While some case write‑ups omit exact deltas, qualitative improvements are consistent—for example, a 2023 Purkay Labs survey: qualitative uniformity improvement after cold‑aisle containment.
Practical acceptance target you can use during commissioning:
Aim for ≤2–3°C (≈3–5°F) variation across rack inlets within a contained aisle at steady IT load. If you exceed that, re‑check blanking panels, brush grommets, roof/door seals, tile CFM balance, and CRAH control logic.
Hot vs. cold aisle—what to implement first and where
Both cold‑aisle containment (CAC) and hot‑aisle containment (HAC) can be effective, but context matters:
Retrofits (brownfield, mixed rack heights, raised floor): Start with CAC. It’s generally simpler to deploy with minimal downtime. Ensure 100% blanking panel coverage, seal floor and cable penetrations, add end‑of‑row doors, and only use perforated tiles inside the contained aisle.
Greenfield (ceiling return or return plenum available): HAC tends to deliver stronger isolation and higher stable supply setpoints, provided you integrate return paths and suppression coverage in design.
Measured outcomes: Peer literature indicates both CAC and HAC can push ASE into ≈86–92% with HAC often edging ahead in isolation; SHI can trend toward ~0.1 in optimized HAC scenarios, per the 2024 Frontiers paper: HAC often achieves the lowest SHI.
Think of it this way: CAC is your fast, low‑disruption retrofit lever; HAC is your long‑horizon, integrated design lever.
Quick ROI math you can defend
Cooling savings are the financial engine behind containment—especially when you raise chilled‑water or CRAH supply setpoints safely. Neutral programs and case studies provide direction:
ENERGY STAR examples show quick payback when containment is paired with better sensing and higher setpoints. One program write‑up notes a hot‑aisle containment project where chilled‑water setpoint rose from 50°F to 60°F, delivering about a one‑year payback; another documents a curtain‑style containment at a network site that improved PUE from 2.2 to 2.0 with ROI under a year. See the ENERGY STAR summaries: setpoint raise with HAC, ≈1‑year payback and curtain containment, PUE 2.2→2.0, ROI < 1 year.
Industry and peer syntheses frequently cite cooling energy savings in the 20–35% range for well‑executed containment; use this as a conservative planning band while you collect site‑specific data. ENERGY STAR’s broader guidance frames 5–10% overall energy expense improvements from airflow measures, depending on baseline: containment savings context.
Worked Example A (10–20 kW per rack retrofit, CAC):
Assumptions: 200 kW IT load for the contained zone; cooling energy is 35% of facility kWh; electricity $0.12/kWh; 8,760 h/year; savings 30% on the cooling portion after CAC and setpoint optimization.
Baseline cooling kWh/year ≈ 200 kW / average IT utilization factor (assume 0.6) → 333 kW facility demand equivalent; at 35% cooling share ≈ 117 kW cooling. Annual cooling energy ≈ 117 kW × 8,760 ≈ 1,026,000 kWh.
Savings ≈ 30% × 1,026,000 ≈ 307,800 kWh → $36,936/year.
CAPEX placeholder: $60,000 for doors, partial roof, blanking, grommets, install (validate with quotes).
Simple payback ≈ $60,000 / $36,936 ≈ 1.6 years.
Worked Example B (20–40 kW per rack greenfield, HAC):
Assumptions: 500 kW IT for the target block; cooling share 35%; electricity $0.12/kWh; savings 30% on cooling after HAC with return plenum integration; modest additional setpoint lift.
Baseline cooling ≈ 500 kW / 0.6 utilization → 833 kW facility equivalent; 35% to cooling → 292 kW; annual ≈ 2,557,000 kWh.
Savings ≈ 30% × 2,557,000 ≈ 767,100 kWh → $92,052/year.
CAPEX placeholder: $180,000 for integrated HAC roof/doors/return ducting.
Simple payback ≈ $180,000 / $92,052 ≈ 1.95 years.
Sensitivity notes:
If electricity is $0.08/kWh, paybacks lengthen proportionally; at $0.20/kWh they shorten.
If your baseline airflow management is already excellent, the savings percentage should be dialed down; conversely, poor baselines often yield larger gains.
Always replace CAPEX placeholders with 2–3 vendor quotes; neutral sources suggest per‑rack retrofit costs around $400–$1,500 and per‑square‑foot ranges of roughly $150–$400, but confirm locally.
Sensor placement and a commissioning script
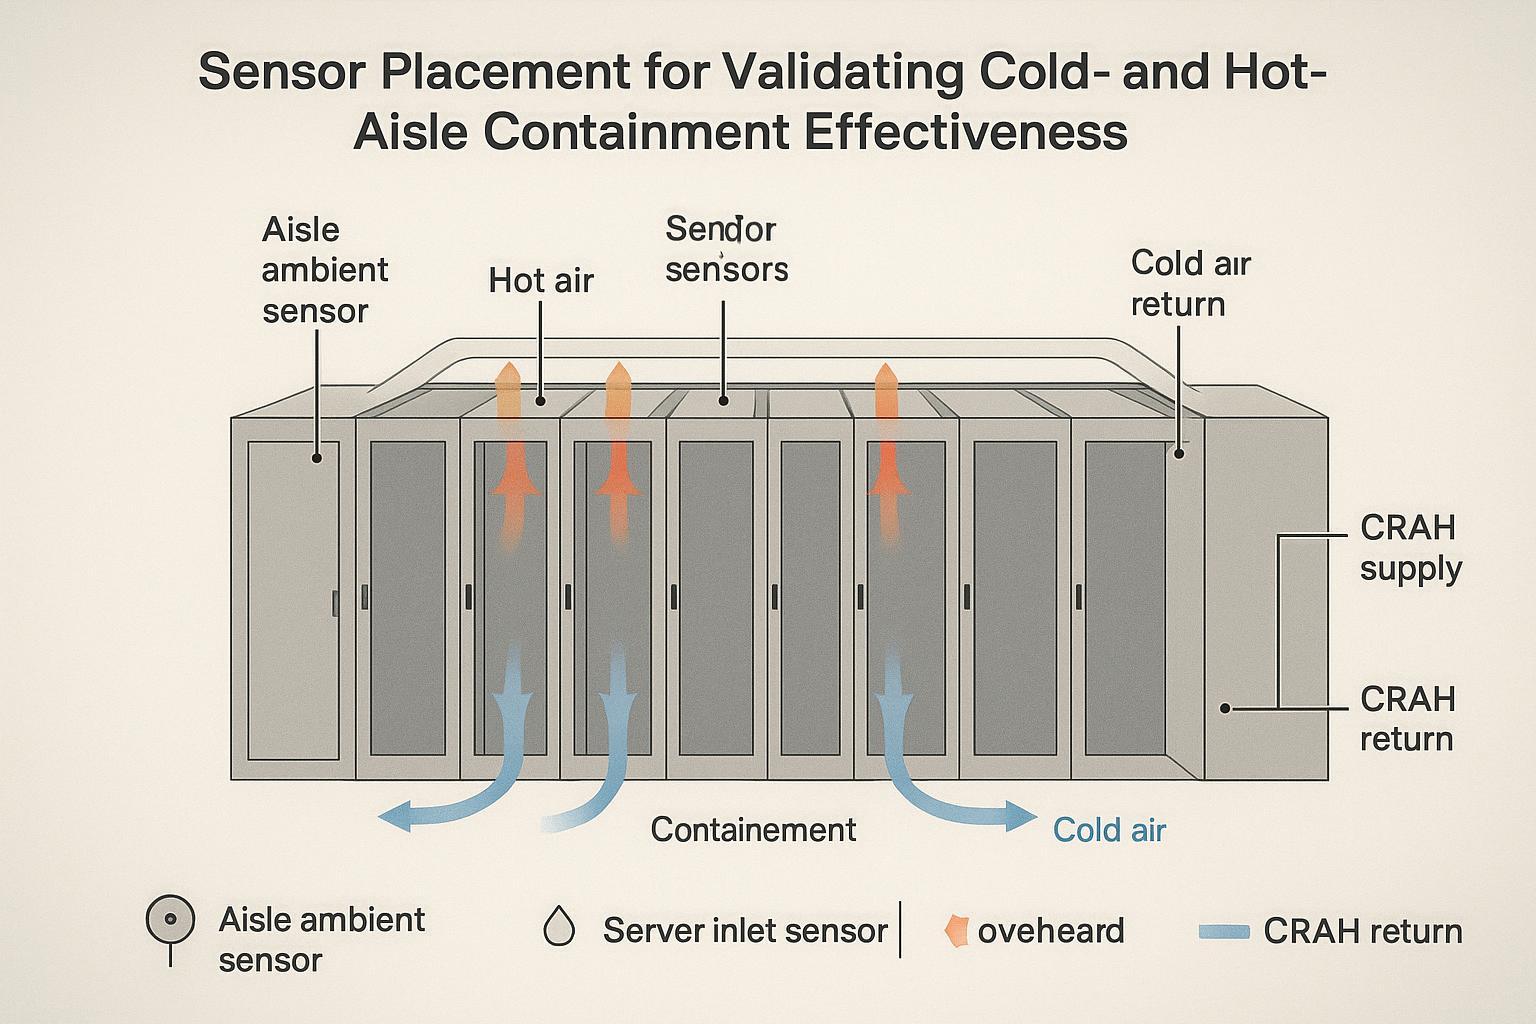
Your commissioning goal is simple: prove uniform, code‑safe operation before raising setpoints. Where should sensors go?
Recommended map (aligned with ASHRAE‑style practice and LBNL/Upsite summaries):
Server inlets: Top, middle, and bottom at the front of representative racks (every fourth rack as an operations minimum; use every rack for detailed surveys).
Aisle ambient: One sensor near each end door at mid‑height and one at aisle centerline; add an overhead point for stratification checks.
CRAH/CRAC: Supply and return temperature (and ΔP if available) to validate control logic.
Commissioning acceptance script (24–72 hours, steady IT load):
Baseline: With containment installed, verify 100% blanking panels; seal cable cutouts and under‑rack gaps; ensure perforated tiles exist only inside cold aisles.
Stabilize: Hold existing setpoints for 2–4 hours; confirm server inlet temperatures sit within ASHRAE recommended ranges (18–27°C for A1/A2).
Uniformity check: Target ≤2–3°C variation across rack inlets at top/mid/bottom. If not met, fix leaks, rebalance tiles, and re‑test.
Controlled optimization: Raise supply setpoint in 0.5–1.0°C increments. After each step, verify inlet uniformity and equipment alarms remain clear.
Fan strategy: Reduce fan speeds where control logic allows; monitor CRAH approach temperatures and coil performance.
Document: Log pre/post readings, setpoint steps, alarms, and corrective actions. Trend PUE for at least a week post‑change.
For a practical overview of the underlying temperature guidance, see LBNL’s summary slide deck: Temperature measurements and thermal guidelines, and Upsite’s explanation of sensor placement practices: sensor location guidance.
Code‑compliant designs across regions without drama
Final acceptance belongs to your Authority Having Jurisdiction (AHJ). Structure your reviews around these recurring checkpoints:
Means of egress (IFC/IBC): Treat contained aisles as part of the egress path. Maintain clear widths commonly at or above 44 in (1118 mm), subject to occupant load and local amendments. Door encroachments, projections, and hardware must not reduce the clear width below code during operation. Example jurisdiction adopting IFC 2021 references these principles: IFC/IBC egress width and projections example.
Fire detection (NFPA 72): High‑airflow environments may require closer detector spacing/placement and analysis when ACH is high or volumes are partially enclosed. Coordinate with your fire alarm vendor and AHJ; see an industry overview of data center detection considerations: smoke detection in high‑airflow IT spaces.
Protection of IT equipment (NFPA 75/76): Where containment creates obstructions, sprinklers or clean‑agent nozzles and detector layouts may need adjustment; some AHJs request drop‑away panels or listed materials above sprinklers. For context on the 2024 direction of NFPA 75 text, see this accessible draft reference: NFPA 75 2024 revision draft overview.
EN 50600 (EU): Airflow separation/containment aligns with EN 50600‑2‑3 environmental control and fire protection principles in EN 50600‑2‑5, applied via risk assessment and local code overlays. See a standard overview here: EN 50600 data center standard summary.
Best practice: Engage the AHJ early, present drawings showing egress clearances, material ratings (e.g., ASTM E84/UL 723 Class A), and detection/suppression coverage, and document meeting notes in the project file.
Universal checklists (vendor‑neutral)
Survey and design
Map server inlet temperatures (top/mid/bottom) across racks; record CRAH supply/return and tile CFM.
Identify bypass/recirculation paths: empty U‑spaces, floor penetrations, open cable cutouts, door/roof gaps.
Select CAC vs. HAC based on retrofit constraints vs. greenfield integration; confirm return paths (ceiling or ducted) for HAC.
Pre‑consult the AHJ on egress, detection, and suppression; specify material flame/smoke ratings.
Procurement
Doors: no floor threshold; self‑closing; panic‑compatible; clear width maintained.
Roof/curtains: drop‑away or listed materials where required; coordinate with sprinklers or clean agents.
Accessories: blanking panels, brush grommets, cable sealing, floor grommets, end‑of‑row doors, signage.
Monitoring: inlet temperature sensors (wired/wireless), CRAH/CRAC points, data logging platform.
Installation
Sequence to minimize downtime; isolate work areas; verify egress clear widths during install.
Install doors, roof/curtains, and seals; ensure perforated tiles only in cold aisles; adjust tile CFM.
Close under‑rack gaps; finish 100% blanking coverage; label containment zones.
Commissioning
Run 24–72 h steady‑load test; verify inlets in ASHRAE recommended range.
Confirm ≤2–3°C inlet variation across the aisle; fix leaks and re‑balance if out of spec.
Incrementally raise supply setpoint; verify alarms; record fan speed reductions and PUE trend.
Operations handoff
Set alarm thresholds for inlet temperatures and rate‑of‑change; define PM for seals/doors/panels.
Re‑survey after significant IT changes; keep a change log tied to thermal maps.
Field snapshots (anonymized)
Snapshot 1 — Brownfield CAC, mixed rack heights, raised floor
Before: Inlet variation 6–8°C across the aisle; frequent throttling in top‑of‑rack GPUs; ASE (model‑assisted) ≈ 72%.
Actions: 100% blanking, brush grommets, end‑door install, perforated tiles confined to cold aisles, controls tuned.
After: Inlet variation 2–3°C; ASE (spot‑checked model) ≈ 88–90%; setpoint +1.5°C; fan speed −10%; projected cooling kWh −25–30%. Reference context on ASE gains: Frontiers 2024 ASE/SHI outcomes.
Snapshot 2 — Greenfield HAC with ceiling return
Before: Design model predicted SHI ≈ 0.12 at target load, ASE ≈ 91%.
Actions: Ducted hot aisle to ceiling return, coordinated sprinklers/detectors; commissioning per script.
After: Inlet variation 1.5–2.0°C; setpoint +2.0°C; cooling kWh −30–35% year‑over‑year in the block, aligning with industry planning bands. Quick‑payback analogs from ENERGY STAR: sub‑1‑year ROI examples.
Practical micro‑examples (neutral)
Example — Containment installation detail you can replicate
During a CAC retrofit, a standardized accessory kit (doors, roof panels or curtains, blanking, brush grommets) simplifies sequencing and helps guarantee 100% sealing coverage. For a reference on how modular systems are packaged in greenfield builds, see the neutral overview of modular options in the Coolnet resource: Coolnet modular data centers and integrated containment options. Use this as context only; always verify component ratings and egress clearances with your AHJ.
Example — Commissioning aids
Teams often pair wired inlet sensors with temporary wireless probes during the 72‑hour acceptance window to capture stratification and spot drafts near doors. For additional context on high‑density cooling considerations, see this technical article: Coolnet’s guide to energy‑efficient cooling for 20–40 kW racks.
Next steps and resources
If you’re planning a retrofit this quarter, start with the survey checklist, run the commissioning script on a pilot aisle, and document AHJ feedback early. For background reading on capacity planning impacts and scaling ROI assumptions, see this primer: data center capacity planning best practices.
Further evidence and program resources referenced in this guide include peer‑reviewed airflow metrics and neutral program case studies: Frontiers in Built Environment on ASE/SHI improvements, LBNL’s measurement guidance, and ENERGY STAR’s practical examples of quick payback with temperature setpoint optimization: setpoint raise example.
—
Note: Always consult the adopted editions of IFC/IBC, NFPA 72/75/76, or EN 50600 in your jurisdiction, and document AHJ decisions in your project file. That’s how you keep improvements defensible and repeatable.