If you’re buying or deploying modular data centers, claims come fast: “on time,” “PUE under X,” “supports 60–100 kW per rack.” Here’s the deal—without a verification-first approach, those promises are hard to compare and even harder to enforce. This checklist gives you a replicable way to validate three things that matter most: end‑to‑end delivery schedule, energy efficiency under an ISO‑aligned boundary, and sustained AI/HPC rack density under realistic thermal conditions. It’s built for owners’ reps, commissioning leads, and procurement teams who need evidence, not marketing.
User-selected baselines enforced here:
Schedule: end‑to‑end milestone on‑time rate across FAT → shipment → onsite lift → SAT/IST → RFS.
PUE: ISO/IEC 30134‑2 Utility‑in boundary with a time‑weighted 30‑day acceptance window, then roll into 12‑month trend.
AI density: rated continuous kW per rack at 35°C return‑water, N or N+1 redundancy, and server inlet ≤27°C aligned to ASHRAE TC 9.9 guidance.
Key takeaways
Treat “on time” as a metric: track per‑milestone on‑time rates with signed FAT/SAT/IST artifacts and an immutable change‑order ledger.
For PUE, fix the boundary first: use ISO/IEC 30134‑2 Utility‑in and IT‑energy at UPS/PDU outputs, then compute a time‑weighted 30‑day average with disclosures.
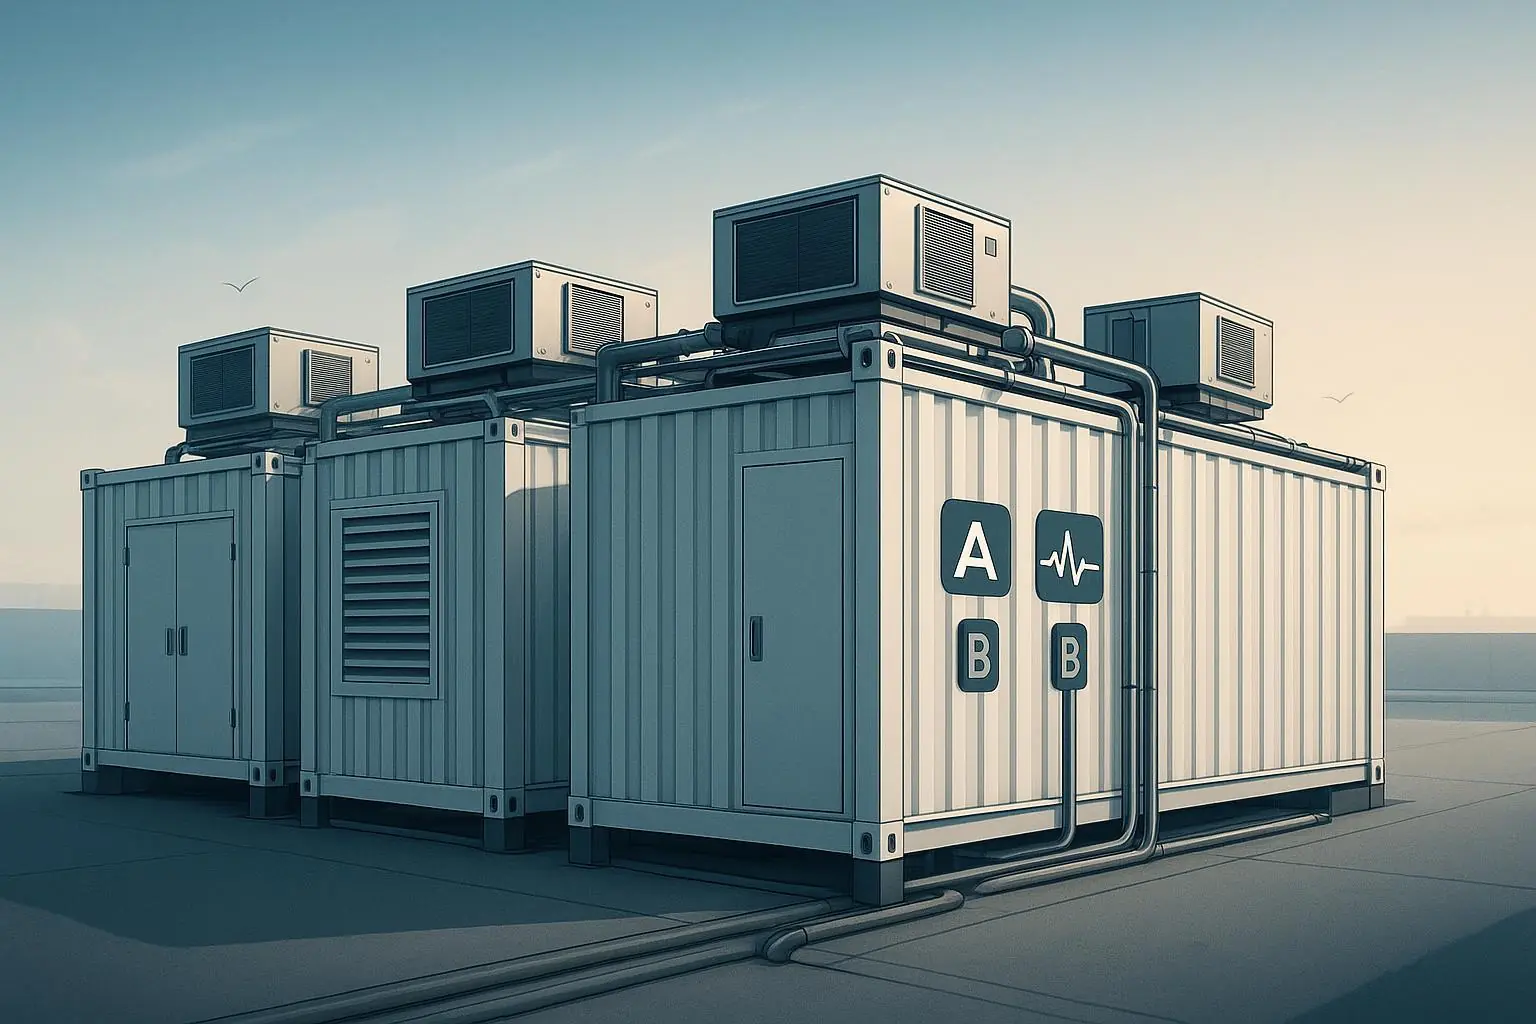
Validate AI density with a step‑load script and a rapid ramp while keeping inlets ≤27°C and documenting redundancy behavior at N or N+1.
Bring a third party: a commissioning agent or accredited reviewer should witness critical tests, verify meter points, and re‑calculate PUE from raw exports.
Package the proof: maintain a standardized evidence packet so every claim can be traced, recalculated, and re‑verified.
How to use this checklist
Apply it phase by phase from factory to early operations.
For each item, collect the named artifact, record the acceptance metric, and obtain the specified sign‑off.
If a vendor’s claim doesn’t map to an artifact and threshold, treat it as non‑evidence until proven otherwise.
Phase-by-phase modular data center validation checklist
The tables below condense what to collect, how to judge it, and who should sign.
Pre‑factory and factory testing FAT
What to collect | Metric or acceptance | Third‑party role |
|---|---|---|
FAT procedure, pass/fail reports, certificates of conformance, calibration certs, timestamped photos/videos tied to serial numbers | FAT complete, all critical tests passed; instrument accuracy within spec; variance log closed | Commissioning agent (CxA) witnesses key tests and signs witness log |
Milestone register with baseline dates | On‑time rate per milestone; baseline preserved with change‑order deltas | Auditor reconciles baseline vs. actuals |
Load bank plan for density tests, sensor placement map | Test readiness confirmed; safety and leak‑detection checks complete | CxA reviews test script and safety plan |
Pre‑shipment and logistics readiness
What to collect | Metric or acceptance | Third‑party role |
|---|---|---|
Packing lists, waybills, customs clearances, insurance | Zero major discrepancies; chain of custody intact | Auditor samples documents for completeness |
Crane/lift plan, site access, pad readiness | Lifts executed within planned window; no damage incidents | CxA or safety officer signs lift diary |
Preservation and storage controls | Environmental limits maintained; condition reports clean | CxA verifies and initials preservation log |
Onsite installation and SAT
What to collect | Metric or acceptance | Third‑party role |
|---|---|---|
Receiving inspection, installation checklists, punch lists and closeout | All deficiencies closed prior to IST; as‑built redlines updated | CxA closes deficiencies and signs SAT form |
Power and cooling interface tests, breaker settings, protection coordination | Settings match approved study; protection selectivity verified | Independent reviewer initials test sheets |
Network and controls integration tests | Communications stable; alarm/point-to-point checks pass | CxA signs network/controls checkout |
Integrated systems testing IST
What to collect | Metric or acceptance | Third‑party role |
|---|---|---|
IST matrix with failure scenarios and recovery steps | All scenarios executed and passed; alarms and recoveries within spec | CxA witnesses and signs IST report |
End‑to‑end milestone closeout | Milestone on‑time rate and total variance in days reported | Auditor reconciles artifacts to register |
RFS/energization certificates | RFS issued and archived | Owner’s rep validates scope and date |
Early operations 30‑day run for quick acceptance
What to collect | Metric or acceptance | Third‑party role |
|---|---|---|
Meter list and IDs, locations, accuracy class, calibration dates | Conforms to ISO/IEC 30134‑2 Utility‑in boundary; IT energy at UPS/PDU outputs | Independent reviewer verifies meter points |
Time‑series exports at 5–15‑minute intervals | No major data gaps; timestamps synchronized | Reviewer checks data integrity and sampling |
Weighted 30‑day PUE calculation and disclosures | Time‑weighted average computed; disclose IT load %, cooling mode mix, events | Reviewer recalculates and issues validation letter |
According to the ISO/IEC definition, PUE is Total Facility Energy divided by IT Equipment Energy; use the official standard for boundary and method alignment and reference its listing rather than quoting proprietary text. See the ISO listing for PUE’s scope in the 30134 series via the public standard page in the ISO 30134‑2 overview. For transparency norms and independent assessment practices, the IEA 4E 2024 labels report provides helpful context. Public operators also share metering and reporting cadence; for example, Google describes continuous metering and rolling disclosure on its data center efficiency page.
PUE acceptance 30‑day window
Fix the boundary, then the math. Use a Utility‑in Total Facility Energy numerator and IT‑energy at UPS/PDU outputs aligned to ISO/IEC 30134‑2. Log data at 5–15‑minute intervals and compute a time‑weighted average over 30 consecutive stable days post‑IST.
PUE calculation example
Given: 30 days of 15‑minute samples (96/day = 2,880 intervals)
For each interval i: PUE_i = Facility_kWh_i / IT_kWh_i
Weighted 30‑day PUE = (Σ Facility_kWh_i) / (Σ IT_kWh_i)
Disclose: average IT load vs. design (%), cooling mode mix, notable maintenance, any energy reuse (reported separately per ISO series)
Common disclosure fields for your calculation workbook
Field | Example |
|---|---|
Meter IDs and locations | Utility‑in M1 at main incoming; IT feeders UPS‑A‑OUT, UPS‑B‑OUT |
Sampling interval | 15 minutes |
Time window | 2026‑04‑01 00:00 to 2026‑04‑30 23:59 |
Average IT load vs. design | 58% of design IT kW |
Cooling mode mix | 70% liquid loop, 30% mechanical assist |
Notable events | 2‑hour maintenance on CDU, flagged and excluded per policy |
Tip: After quick acceptance, maintain quarterly and trailing‑twelve‑month series before publicizing site‑level values, a practice described in Google’s efficiency disclosures and consistent with transparency recommendations in the IEA 4E 2024 report.
AI rack density test protocol
Goal: verify sustained kW per rack under a realistic load while keeping server inlet temperatures at or below 27°C, which aligns to the recommended inlet range cited in ASHRAE TC 9.9 reference materials. For liquid loops, hold return water at 35°C as your declared test condition. Prove behavior at N and N+1 redundancy.
Test script essentials
Element | Requirement |
|---|---|
Step‑load profile | 70% → 85% → 100% of target kW/rack with ≥2 hours steady‑state at each step |
Rapid ramp segment | ≥10%/min from 70% to 100% without inlet excursions or throttling |
Instrumentation | Per‑rack true‑RMS power; inlet sensors top/mid/bottom; CDU supply/return temps and ΔT; flow; differential pressure; leak detection status |
Thermal limits | Inlet ≤27°C throughout; log any excursions |
Redundancy check | For N+1, impair one cooling path during 85–100% segment; no thermal violations allowed |
Evidence package | Raw CSV exports, sensor map, calibration certs, witness signatures, pass/fail summary |
Helpful field practice: when combining liquid‑cooled and air‑cooled load banks during commissioning, hybrid approaches can create realistic heat rejection and airflow interactions. See a practitioner discussion in Avtron’s hybrid load‑bank article. For inlet ranges and monitoring emphasis, rely on publicly available ASHRAE guidance summaries rather than quoting paywalled specifics.
Third‑party attestations and how to verify
Availability and infrastructure programs publish scopes and rules. Uptime Institute issues Tier certifications for Design, Constructed Facility, and Operational Sustainability; confirm scope and status using the issuer’s program pages and, if necessary, direct confirmation. See Uptime Institute’s Tier overview.
For rated infrastructure schemes with public directories, request the original certificate and verify validity windows and scope in the directory. TIA‑942 maintains a directory and program description; start with TIA’s program and directory pages and then search the certified data centers directory.
European conformance often appears via accredited bodies. Many certificates are traceable through third‑party registries such as Certipedia; use these to confirm the issuing body and scope.
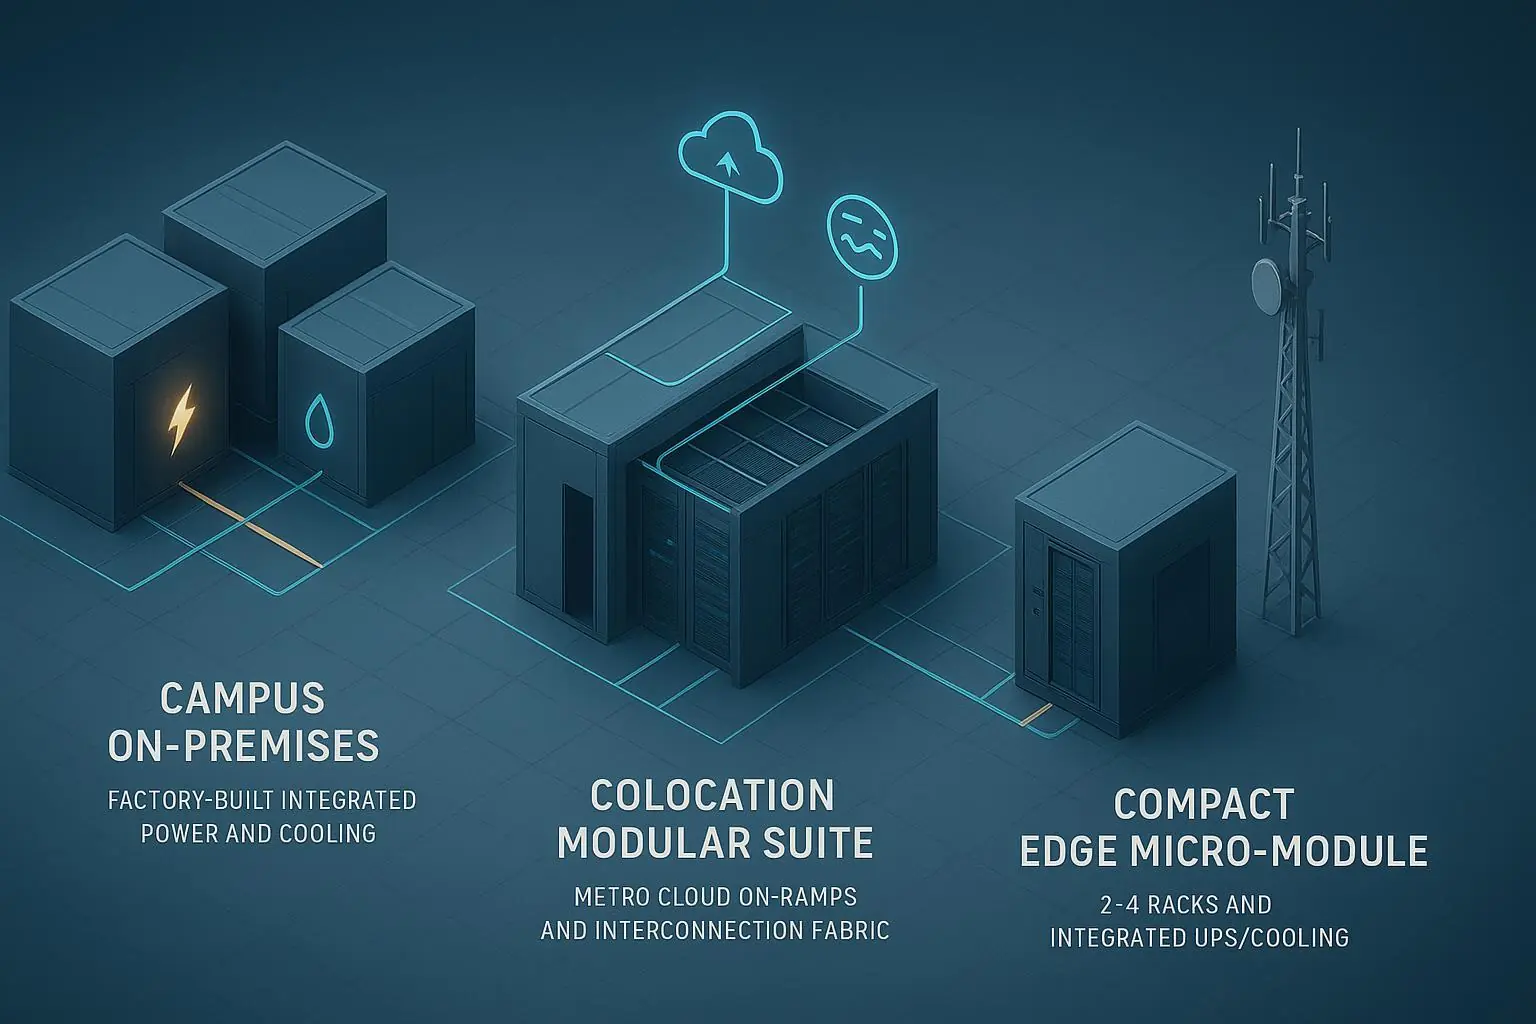
Variants and shortcuts for different deployment scenarios
Scenario | What to test fully | What to sample |
|---|---|---|
First pod of a series | All checklist items including full density script and 30‑day PUE | None; this is your golden unit |
Subsequent identical pods | Schedule ledger, SAT/IST core scenarios, spot density tests on 20–30% of racks | Full 30‑day PUE only if topology or climate differs materially |
Brownfield retrofit into existing halls | Isolation of meters to maintain Utility‑in accounting; interface protection tests | Density testing where access is limited—use representative racks |
When to escalate to an independent lab or extended witness
When meter accuracy or calibration evidence is missing or disputed.
When density tests approach envelope limits or repeated excursions occur.
When schedule claims rely on baseline resets without traceable change‑order impact.
Evidence packet templates you can copy
A. Schedule evidence ledger
Field | Description |
|---|---|
Milestone name | Example: FAT complete, Shipment departed, Onsite lift, SAT signed, IST passed, RFS issued |
Planned date | From original baseline Gantt |
Actual date | From signed artifact |
On‑time Y/N and variance days | Simple pass/fail plus numeric variance |
Witness present and name | CxA, auditor, owner’s rep |
Artifact link | Report ID, file path, or vault reference |
Root‑cause category | Supply chain, permitting, site power readiness, weather, change order |
Corrective action and remarks | What was done and when |
B. PUE metering and calculation workbook fields
Field | Description |
|---|---|
Meter IDs, locations, accuracy class, calibration date | Enumerate Utility‑in and UPS/PDU IT meters with specs |
Sampling cadence | 5–15 minutes; justify choice |
Time window and exclusions | 30 consecutive stable days; state any exclusions and why |
Facility and IT energy exports | CSV files with timestamps, units, and quality flags |
Weighted 30‑day PUE result | Computed from totals; show formula and units |
Disclosures | IT load vs. design %, cooling mode mix, maintenance notes, any energy reuse |
C. Density test data capture
Field | Description |
|---|---|
Rack ID and target kW | Declared continuous rating under test |
Sensor map | Inlet sensors top/mid/bottom; CDU points; DP taps |
Step loads and dwell times | Actual times and kW achieved per step |
Rapid ramp segment | Start/end times, rate, stability |
Redundancy impairment details | Which path impaired and duration |
Excursions and alarms | Count and duration; cause and corrective actions |
Pass/fail summary | Achieved sustained kW/rack, throttling observed Y/N |
Final notes and further reading
PUE definition and boundary alignment details are described in the ISO 30134‑2 standard overview. Use it as your canonical reference point and procure the full text for procurement and compliance work.
For independent assessment and transparency practices, consult the IEA 4E 2024 data center labels report.
Think of this modular data center validation checklist as your repeatable acceptance harness. Use it to defend schedules, normalize PUE claims across climates and boundaries, and pressure‑test AI rack density before tenants arrive. Then keep iterating: the first pod sets the bar, and the rest should follow it, not re‑argue it.