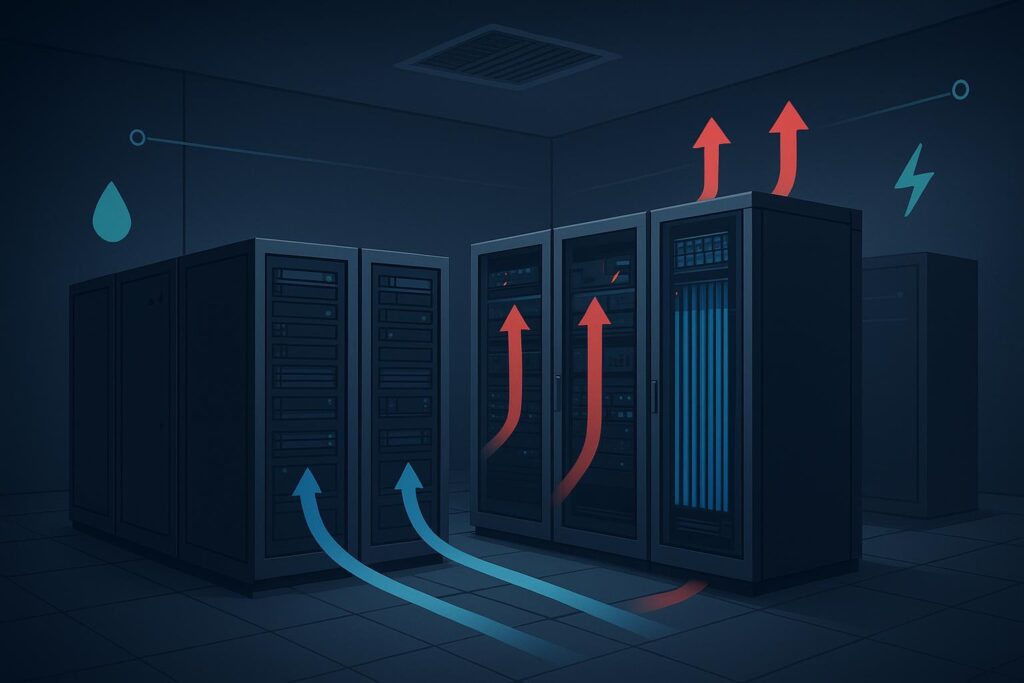
Mixed‑density server rooms are now the norm: a few AI or analytics racks at 30–100 kW sit beside conventional 5–20 kW rows. Leaders responsible for SLA, compliance, and portfolio efficiency need realistic target bands—not wishful thinking—plus an audit‑ready way to prove results across multi‑site edge and micro deployments.
This checklist anchors targets to ISO/IEC 30134 KPIs (PUE v2, WUE annualized, CER), uses IPMVP Options B/C for measurement and verification, and calls out where climate and density push numbers up or down. We reference authoritative guidance such as the U.S. Department of Energy’s Best Practices (2024), Uptime Institute surveys, and reputable industry explainers for WUE context.
According to the U.S. Department of Energy’s 2024 guide, operating within ASHRAE thermal envelopes and maximizing economizer hours cuts parasitic load while preserving reliability. Uptime’s recent surveys indicate global fleet PUE averages have plateaued near the mid‑1.5s as legacy stock dominates, emphasizing the value of targeted upgrades. For WUE, reputable explainers and operator pages show averages near ~1.8 L/kWh with best‑practice sites much lower, depending on design and water strategy.
Table of Contents
ToggleKey takeaways
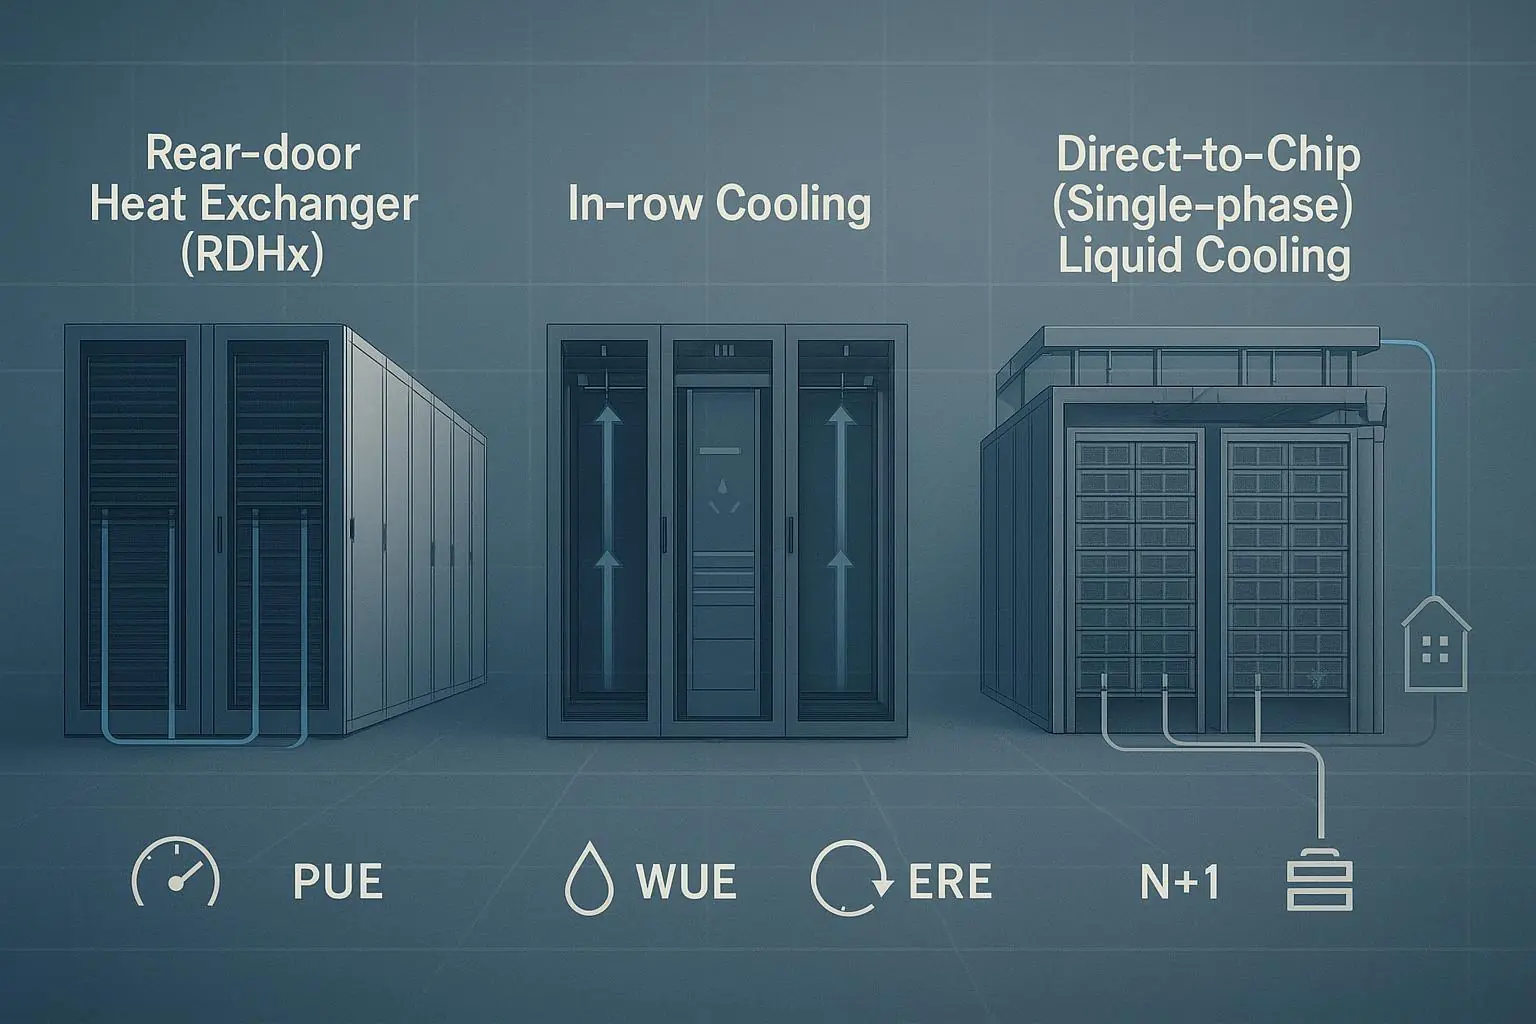
In temperate climates with strong airflow management and economizers, containment‑only air systems in mixed rooms often land around ~1.25–1.50 PUE; hot‑humid sites trend higher.
Adding selective liquid assist (rear‑door heat exchangers or direct‑to‑chip on 30–100 kW racks) typically enables portfolio‑level PUE bands near ~1.15–1.30 when integration and controls are solid.
WUE is highly context‑dependent: industry resources cite averages near ~1.8 L/kWh; sub‑1.0 L/kWh is achievable at some sites through air‑cooled strategies, reclaimed water, or climate advantages—state your boundaries.
Advanced controls (setpoint reset, static pressure/flow optimization, AI/ML supervisory control) commonly reduce cooling energy by double‑digit percentages in studies and pilots, improving PUE by roughly 0.03–0.08 points from typical baselines.
Acceptance must be standards‑aligned: use PUE (ISO/IEC 30134‑2), WUE annualized (ISO/IEC 30134‑9), and CER (ISO/IEC 30134‑7) with IPMVP Option B or C and documented uncertainty.
Containment‑only or hybrid? A quick decision matrix for data center PUE WUE targets
Use this matrix to choose your initial target band. Always document climate, density, and control assumptions. Including the phrase data center PUE WUE targets here helps keep the guidance discoverable for teams standardizing across sites.
Mixed‑density context | Temperate climate with many economizer hours | Hot‑humid climate with limited economizer hours |
|---|---|---|
Majority ≤20 kW/rack, good containment and sealing | PUE target: ~1.25–1.40; WUE: 0.5–1.0 L/kWh (air‑cooled or limited evap). | PUE target: ~1.35–1.55; WUE: 1.0–2.0+ L/kWh (evap likely). |
Hot zone 30–60 kW/rack, apply RDHx/D2C only to hot racks (hybrid) | PUE target: ~1.15–1.30; WUE depends on evap use: 0.3–1.2 L/kWh. | PUE target: ~1.25–1.40; WUE: 1.2–2.5+ L/kWh (watch tower cycles). |
Several racks 60–100 kW, liquid assist plus strict airflow QA | PUE target: low‑1.1x–1.25; WUE varies widely; consider non‑potable sources. | PUE target: ~1.20–1.35; WUE can be high with evap; plan water‑risk mitigations. |
Notes:
PUE/WUE definitions and boundaries must follow ISO/IEC 30134; do not compare apples to oranges.
Economizer logic, setpoints, and leakage control strongly influence where your site lands within each band.
Checklist A — Baseline and target setting for data center PUE WUE targets
Define KPI boundaries per ISO/IEC 30134.
PUE (30134‑2 v2), WUE annualized (30134‑9), and CER (30134‑7). Reference internal boundary diagrams that map to the standards. Keep humidification and cooling‑tower makeup water metering distinct for WUE.
Inventory meters and data cadence.
Main utility, IT energy (PDUs/UPS outputs), CRAH/CRAC, pumps/fans, CDU/RDHx circuits, humidification, and makeup water. Default to 15‑minute electrical intervals; hourly is acceptable for water.
Establish a baseline period and normalize.
For multi‑site portfolios, select a representative 6–12 month baseline. Plan weather normalization and IT‑load normalization for acceptance and reporting.
Classify density bands and hotspots.
Map racks by kW bands (≤10, 10–20, 20–40, 40–80, 80–100). Identify where airflow containment is effective vs where liquid assist is needed.
Quantify economizer hours and constraints.
Document available air‑ or water‑side economizer hours and lockout logic. Record seasonal switchover rules and fault histories.
Set preliminary data center PUE WUE targets by approach.
Containment‑only in temperate climates: start with ~1.25–1.50 PUE; in hot‑humid, ~1.35–1.60. For WUE, temperate air‑cooled sites can be sub‑1.0 L/kWh; evaporative strategies increase WUE.
Decide hybridization scope.
For ≥30–100 kW racks, apply RDHx or direct‑to‑chip on those positions while keeping background loads on air. Portfolio‑level PUE bands near ~1.15–1.30 are realistic when integration and controls are tuned.
Document water risk and permitting.
Capture source quality, discharge permits, drought restrictions, and contingency modes (e.g., dry coolers). Tie these to WUE targets and seasonal strategies.
Create a site‑level evidence plan.
Name the acceptance window, the ISO KPIs to be reported, the M&V option (B or C), and the uncertainty statement you’ll require at acceptance.
Authoritative context for ranges and practices: see the U.S. DOE Best Practices guide (2024), Uptime Institute 2022/2024 surveys, and industry explainers for WUE framing and hybrid cooling discussions. Examples include the DOE’s design guidance, Uptime’s survey reports on average PUEs, and reputable explainers discussing how WUE is calculated and reported by major operators.
Checklist B — Cooling and controls enablement
Seal the airflow path.
Validate hot/cold aisle containment, cabinet sealing, blanking panels, brush strips, and floor grommets. Correct under‑floor bypass and recirculation.
Verify rack‑level ΔT and sensor QA/QC.
Place and calibrate sensors; document calibration cadence and redundancy on critical loops.
Set supply‑air temperature within safe bounds.
Operate within ASHRAE recommended envelopes and reset supply temperatures upward where safe to reduce compressor hours.
Optimize static pressure and fan strategy.
Tune VFDs on CRAH/CRAC units for minimum acceptable static pressure; adopt pressure‑ or flow‑based control rather than fixed speed.
Enable economizers and validate lockouts.
Maximize air‑/water‑side economizer hours; validate lockout temperatures, humidity rules, and seasonal switchover.
Manage humidification and water quality.
Submeter humidification separately; maintain water treatment and blowdown targets; record cycles of concentration.
Add liquid assist where density demands it.
Rear‑door heat exchangers or direct‑to‑chip for 30–100 kW racks; coordinate CDU setpoints with room air setpoints.
Deploy supervisory optimization (AI/ML where appropriate).
Consider model‑predictive or reinforcement‑learning supervisory control after instrumentation is stable. Studies and pilots report 15–30% cooling‑energy savings, directionally improving PUE by ~0.03–0.08 points from typical baselines; verify locally.
Recommission and test failover.
Test switchover, fault responses, and redundancy. Record results and corrective actions.
Track drift.
Establish monthly/quarterly reviews of setpoints, sensors, and alarms to catch efficiency drift.
For deeper airflow tactics and hotspot ROI discussion, see our aisle containment effectiveness guide: Aisle containment effectiveness: hotspots, ROI, and code.
Practical workflow example (hybrid in a mixed‑density room)
A regional edge room with most racks at 10–18 kW and four AI racks at 60–80 kW implements hot/cold aisle containment and seals leakage paths. Rear‑door heat exchangers serve the AI racks; economizers are enabled with verified lockout logic. Supervisory control coordinates CDU and CRAH setpoints with static‑pressure targets. Telemetry and alarms are centralized via Coolnet Data Center Infrastructure Monitoring for visibility and acceptance data collection. This pattern keeps background loads on efficient air while liquid assist handles hotspots, supporting PUE in the low‑1.3s to low‑1.2s (climate and tuning dependent) with explicit WUE trade‑off documentation.
Checklist C — Acceptance, M&V, and reporting
Name KPIs and standards.
PUE (ISO/IEC 30134‑2 v2), WUE annualized (ISO/IEC 30134‑9), CER (ISO/IEC 30134‑7). Use internal boundary diagrams that correspond to the standards.
Select IPMVP option.
Option B for isolated cooling/control retrofits with 15‑minute interval meters on affected equipment; Option C for whole‑facility or multi‑site aggregation with regression normalization.
Define the data window and sufficiency checks.
Minimum 8–12 weeks at representative IT load for acceptance; longer if seasonality affects economizer hours. Document data completeness thresholds.
Normalize for weather and IT load.
Use recent multi‑year weather datasets (not legacy TMY alone). Include IT load as a driver in the model. Record all routine/non‑routine adjustments.
Specify model accuracy targets (Option C).
Adopt ASHRAE Guideline 14 thresholds (e.g., CV(RMSE) ≤ 15% and NMBE ≤ 5% for hourly models; looser for monthly). Include residual plots.
State measurement uncertainty and confidence.
Provide uncertainty bounds and confidence intervals with the acceptance result. Declare sensor accuracy and calibration dates.
Record economizer hours and setpoint adherence.
Compare available vs used economizer hours; document supply‑air and CDU setpoint compliance.
Verify WUE boundary and water management.
Ensure makeup and humidification meters are distinct; include water‑quality/treatment records and cycles of concentration.
Compile the evidence pack.
Interval data exports, model specs, uncertainty statement, acceptance sign‑off, and a one‑page narrative describing climate/density context and any deviations.
Schedule periodic M&V.
Quarterly spot checks and annual re‑baselining as needed; log any equipment or load changes impacting comparability.
Guidance and references: U.S. DOE Best Practices (2024) on setpoints/economizers; EVO’s IPMVP principles and detectability guidance for Options B/C; ASHRAE Guideline 14 accuracy thresholds; ISO/IEC 30134 catalogue pages for KPI anchoring.
Regional incentives that can improve ROI
North America
Benchmarking and recognition can unlock or complement incentives. ENERGY STAR’s Portfolio Manager provides data center benchmarking resources and national median reference values; use these to contextualize targets and document improvements for programs that require benchmarking. See the U.S. national median reference values (Aug 2024) in the ENERGY STAR Portfolio Manager reference and the broader ENERGY STAR benchmarking hub.
For controls‑heavy projects, demand response integration and EMS upgrades may qualify for incentives; as an example reference on telemetry and control strategies, review the PG&E Automated Demand Response Program Manual and consult your local utility’s custom efficiency offerings.
EU/UK
Align designs and operations to CIBSE/BCO guidance for efficient data centres; national Energy Efficiency Obligation Schemes (EEOS) and EU Energy Efficiency Directive reporting frameworks can interact with project documentation. Engage local program portals; use CIBSE/BCO as the technical compass and ensure ISO KPI reporting is consistent.
Southeast Asia
Singapore’s BCA Green Mark for Data Centres (2024 scheme) provides criteria and pathways, including Super Low Energy targets. Review the official page under Other Green Mark schemes for current criteria and submission checklists.
In Malaysia, financing support for efficiency upgrades is available through the Green Technology Financing Scheme; see SEDA’s summary of related fiscal incentives and the GTFS portal for the application process and features of GTFS 4.0.
Appendix — What your M&V templates should include
Your acceptance package should stand on its own in an audit. At minimum, make sure your templates capture:
Meter list and locations mapped to ISO KPI boundaries (main, IT, CRAH/CRAC, pumps/fans, CDU/RDHx, humidification, makeup water) with interval cadence.
Baseline/reporting periods, routine vs non‑routine adjustments, and the weather dataset used.
For Option B: affected equipment meters, calculation steps, and uncertainty statement.
For Option C: model form, drivers (weather + IT load), CV(RMSE)/NMBE targets, residual plots, and savings detection threshold.
Acceptance sign‑off with confidence intervals and sensor calibration attestations.
If you need a neutral, standards‑aligned M&V checklist to adapt across sites, request our template set; we’ll share a clean, vendor‑agnostic version suitable for Option B/C workflows.
References and further reading (selected):
U.S. DOE — Best Practices Guide for Energy‑Efficient Data Center Design (2024): official PDF
Uptime Institute — Global Data Center Survey 2022 and 2024: 2022 survey report, 2024 survey report
DataCenterKnowledge — WUE explainer and hybrid cooling context: WUE guide, hybrid cooling overview
Microsoft — Data center efficiency and water methodology: sustainability page
EVO — IPMVP principles and detectability: Generally Accepted Principles (2018), detecting savings under 10% with Option C
ASHRAE — Guideline 14 accuracy context: addendum reference