Key takeaways
AI-driven thermal optimization is closed-loop, supervisory control that uses live telemetry + predictive models to continuously adjust cooling setpoints under explicit safety constraints.
“Green” is more than PUE: sustainability discussions typically also track WUE, CUE, and sometimes ERE (The Green Grid’s xUE family).
The practical architecture is consistent across air, liquid, and hybrid sites: sensors → data layer → models → optimizer → actuators, with guardrails aligned with ASHRAE TC 9.9 thermal envelopes.
The fastest wins come from reducing overcooling and control conflicts (multiple loops fighting each other), not from chasing a single “best” setpoint.
Definition: what “AI-driven thermal optimization” means
AI-driven thermal optimization for green data centers is a supervisory control approach that uses machine learning (ML) and/or advanced optimization to continuously minimize cooling-related energy, water, and carbon impacts while keeping IT equipment within standards-aligned environmental limits.
In plain terms: instead of running fixed setpoints (or simple rules), the system learns how your facility behaves and then autonomously nudges setpoints—fan speeds, supply temperatures, flow rates—so you meet thermal reliability targets with less overhead.
Key Takeaway: The “optimization” part is not a dashboard. It’s a closed loop: measure → predict → decide → actuate → verify.
Why it matters now (and why it’s tied to “green”)
Three pressures are converging:
Higher rack densities (especially AI/HPC clusters) compress the thermal margin and amplify hot-spot risk.
Sustainability scrutiny is expanding beyond facility power to include water and carbon accounting.
Mixed estates (new builds + retrofits) create control complexity: multiple cooling technologies, zones, and vendors—each with its own local control loop.
A “green” thermal strategy needs the language to talk about outcomes. The Green Grid’s metric family is widely used in that conversation, including PUE and sustainability extensions like WUE and CUE. For example, The Green Grid introduces WUE explicitly as a data center sustainability metric to evaluate water use alongside energy/carbon metrics in WP#35 — Water Usage Effectiveness (WUE™).
Standards alignment: the minimum safe language (ASHRAE + The Green Grid)
ASHRAE TC 9.9: “recommended” vs “allowable” envelopes
When practitioners reference ASHRAE TC 9.9, they’re typically pointing to the idea that IT environments should be managed against defined thermal envelopes—including temperature and humidity—where:
Allowable conditions describe what equipment can tolerate without immediate harm.
Recommended conditions are a tighter band intended to support reliability, operational stability, and prudent risk management.
A practical reference for this is ASHRAE’s Thermal Guidelines reference card (5th edition), which summarizes the envelopes and environmental classes.
The Green Grid: xUE metrics you’ll hear in “green” programs
Thermal optimization is not just about keeping temperatures within limits—it’s also about what it costs you (energy) and what it consumes (water), and the carbon footprint of those inputs.
A minimal metric vocabulary:
PUE: a ratio that captures facility energy overhead vs IT energy.
WUE: a metric The Green Grid proposes to help operators assess water sustainability in data centers (see WP#35 — Water Usage Effectiveness (WUE™)).
CUE and ERE: additional xUE metrics frequently discussed alongside PUE/WUE in Green Grid materials (see compiled references in The Green Grid WUE_v1.pdf).
If you want the primary definitions straight from the consortium, The Green Grid’s library provides guidance on PUE measurement (see “PUE: A Comprehensive Examination of the Metric”) alongside sustainability metrics like WUE.
Pro Tip: Treat xUE metrics as constraints + scorecards, not as a single objective. A cooling strategy that lowers PUE by using more water can move WUE in the wrong direction.
Core components: the minimum viable architecture
AI-driven thermal optimization is usually a layer added above local controllers—not a total replacement. A practical reference stack looks like this:
Sensing & telemetry (environment + equipment + IT load)
Data layer (time sync, cleaning, tagging, context)
Models (prediction + anomaly detection)
Optimizer (decides setpoints under constraints)
Actuators / control endpoints (BMS, PLCs, VFDs, CDUs, chiller plant)
Verification loop (did we hit the goal safely?)
ASCII schematic: closed-loop supervisory control
                 +-----------------------------+
                 |  Goals & constraints        |
                 |  - inlet temp envelope      |
                 |  - humidity / DP limits     |
                 |  - rate-of-change limits    |
                 |  - alarms / change control  |
                 +--------------+--------------+
                                |
+-----------+   +---------------v--------------+   +------------------+
| Sensors   |-->| Telemetry + Context Layer    |-->| Model/Predictor  |
| (T/RH/kW) |   | (time sync, tags, zones)     |   | (load + thermal) |
+-----------+   +---------------+--------------+   +---------+--------+
                                |                            |
                                |                            v
                                |                  +------------------+
                                +----------------->| Optimizer        |
                                                   | (MPC / RL / etc) |
                                                   +---------+--------+
                                                             |
                                                             v
                                                   +------------------+
                                                   | Actuators        |
                                                   | (fans/valves/    |
                                                   |  supply temps)   |
                                                   +---------+--------+
                                                             |
                                                             v
                                                   +------------------+
                                                   | Physical plant   |
                                                   | + data hall      |
                                                   +------------------+
                                                             |
                                                             v
                                                       (back to sensors)
In-article schematic image: supervisory control loop
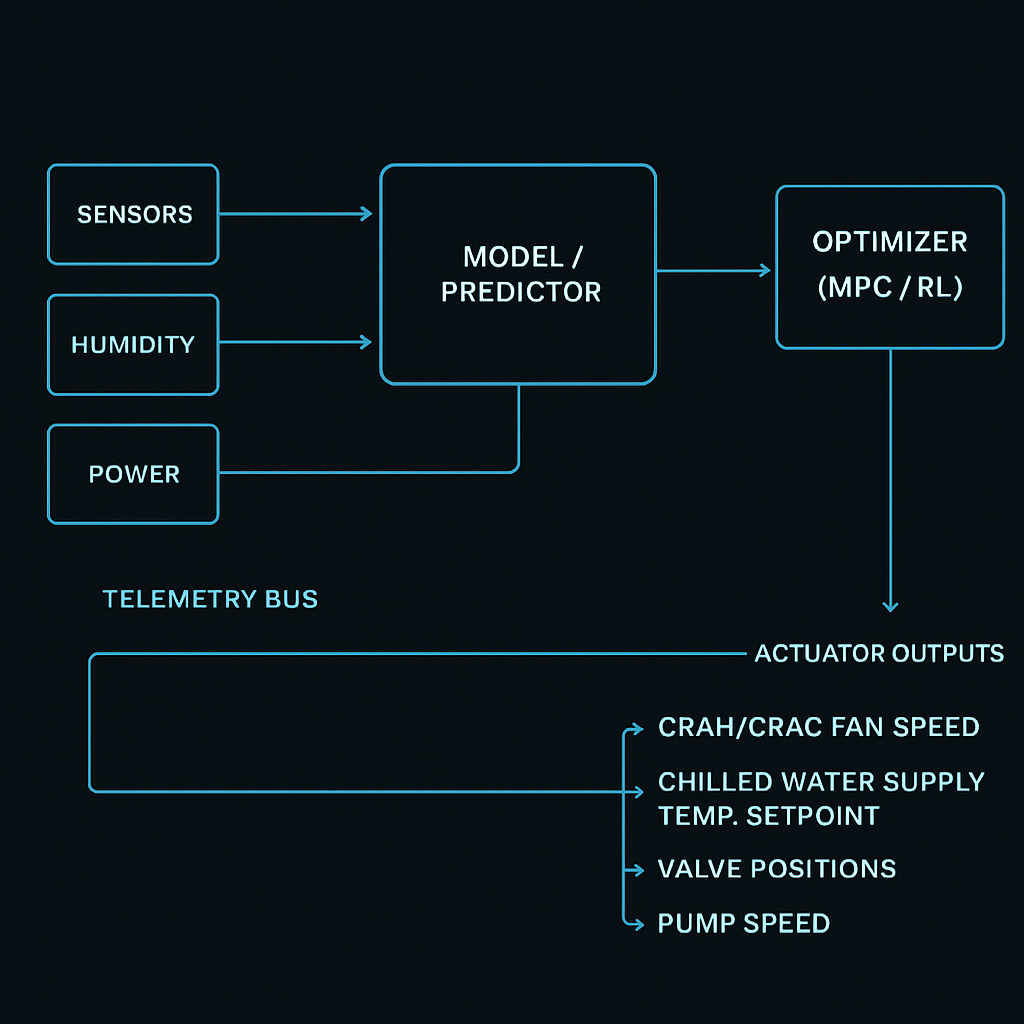
The control loops: what is being controlled (and by whom)
A common source of confusion is thinking “AI changes the temperature.” It doesn’t. Controllers change actuators, and actuators affect temperatures.
In a typical site you’ll see multiple nested loops:
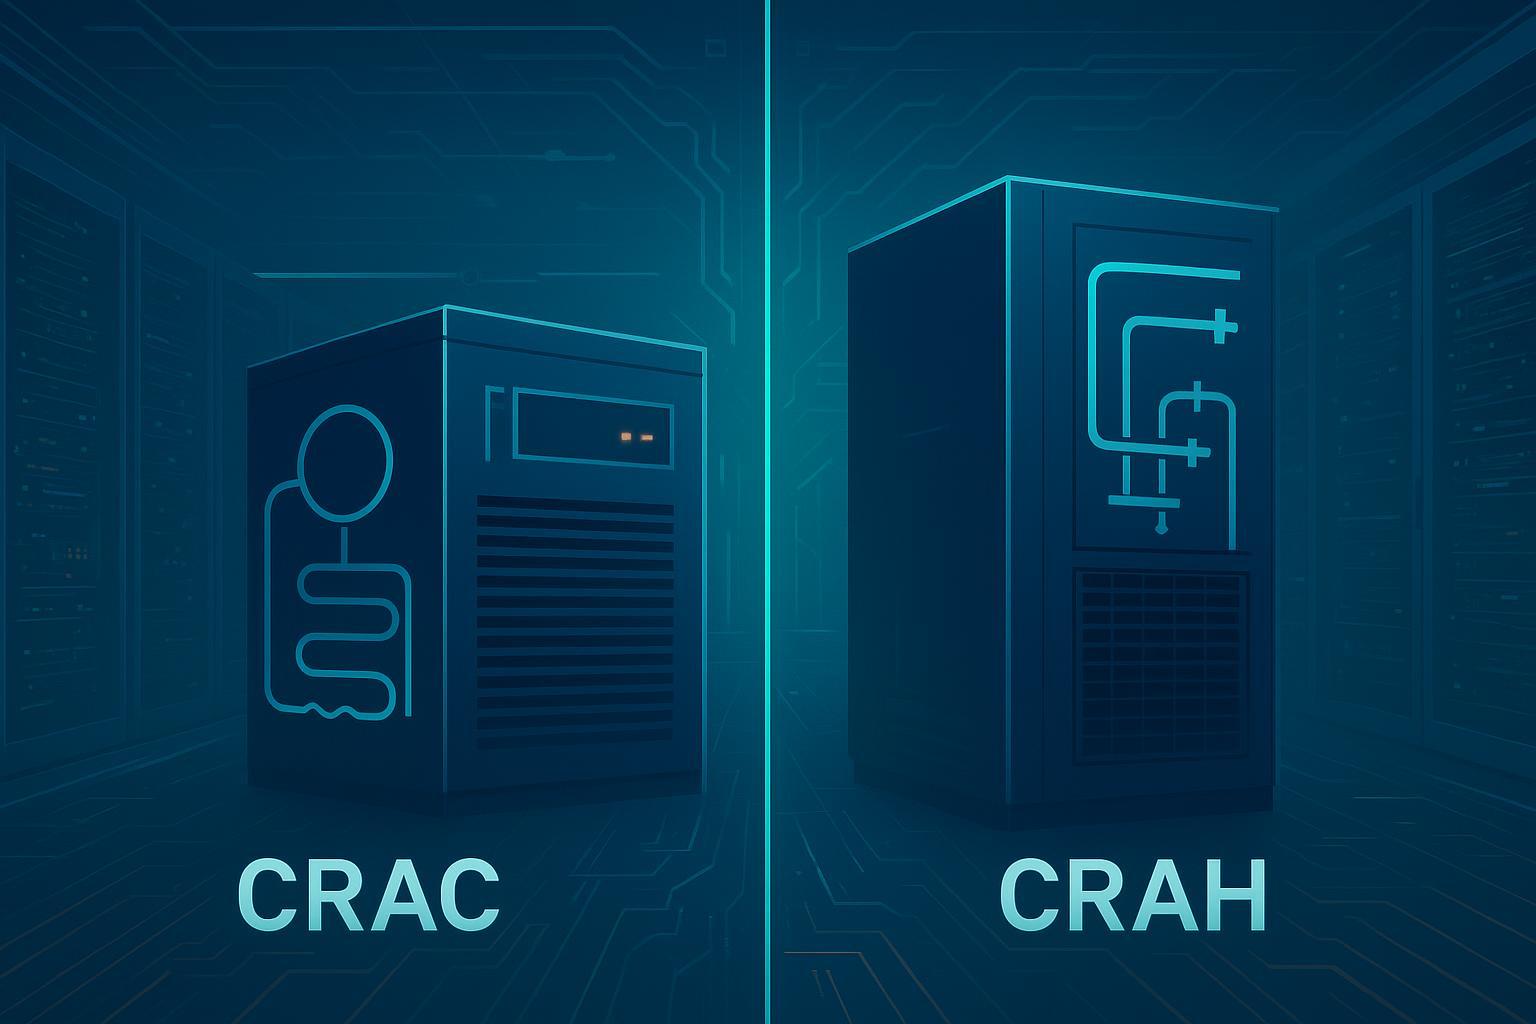
Local equipment loops (fast): CRAH/CRAC fans, valve control, compressor staging.
Plant loops (medium): chilled water supply temperature, pump speed, cooling tower approach.
Supervisory loop (slower, cross-system): AI/optimization layer coordinating targets across zones.
The supervisory layer’s job is to prevent two expensive failure modes:
Overcooling (wasted kW and/or water).
Control conflict (one loop compensates for another loop’s decision).
How autonomous controls adjust setpoints (without breaking reliability)
Setpoint optimization usually follows the same pattern, even if the math differs:
Observe: Inlet temps, return temps, RH/DP, airflow proxies, chilled water temps, pump/fan power, IT load.
Predict: What will happen 5–30 minutes ahead if the workload shifts? Where will the next hot spot appear?
Decide: Choose setpoints that minimize overhead while staying within constraints.
Actuate: Send bounded setpoint changes to BMS/DCIM/equipment controllers.
Verify: Confirm the predicted improvements happened; roll back if constraints tighten.
Typical setpoints the optimizer touches
Data hall air side
CRAH/CRAC fan speed
Supply air temperature
Static pressure targets (where applicable)
Chilled water loop
Chilled water supply temperature (CHWST)
Pump speed / differential pressure
Valve positions
Hybrid + liquid environments
CDU supply temperature / flow targets (when integrated)
Zone-level “who carries the heat” split between air and liquid
Safety guardrails (non-negotiable)
In mature deployments, autonomy is bounded by:
Hard constraints: Don’t violate the chosen ASHRAE envelope for your equipment class.
Rate-of-change limits: Avoid rapid swings that create instability or “yo-yo control.”
Fallback modes: If telemetry quality drops or an anomaly is detected, revert to known-safe setpoints.
Change management: Treat model updates and control-policy changes like software releases.
⚠️ Warning: If the optimizer can explore without constraints, it can “learn” the wrong lesson—especially during unusual days (maintenance, partial failures, or atypical workloads).
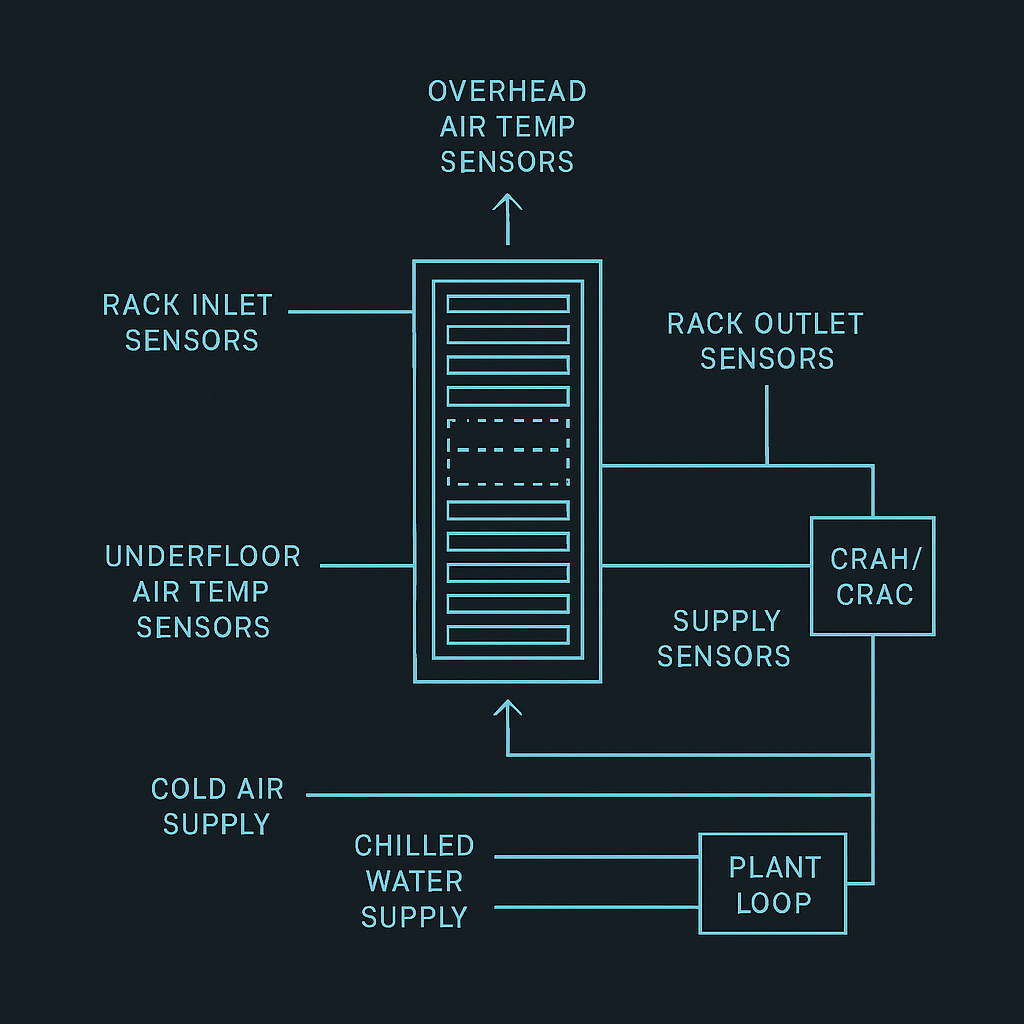
Sensors required for data center thermal management (and where they’re typically placed)
You don’t need perfect instrumentation, but you do need enough observability to connect cause → effect.
Minimum sensor/telemetry checklist
What you measure | Why it matters to optimization | Typical placement |
|---|---|---|
Rack inlet temperature | Primary safety constraint | Front of rack / cold aisle (multiple heights) |
Rack outlet / hot aisle temperature | Indicates heat extraction effectiveness | Rear of rack / hot aisle |
Humidity / dew point | Prevents corrosion/ESD risk zones | Representative room points; near economizer mixing |
Supply/return air temps | Tracks cooling performance | CRAH/CRAC supply + return |
CHW supply/return temps | Measures coil-side capacity and efficiency | Plant + near CRAHs |
Flow / valve position (where possible) | Confirms actuation actually occurred | On loops, CDUs, branches |
Power (IT + cooling subsystems) | Enables objective functions tied to kW | PDU/UPS telemetry, cooling power meters |
In-article schematic image: sensor placement map
Does it work with mixed legacy and new builds?
Yes—if you treat integration as a first-class design problem.
In mixed estates, the winning pattern is:
Start with read-only monitoring + analytics (no actuation).
Add bounded actuation for 1–2 setpoints in a pilot zone.
Expand to additional loops only after you’ve proven:
sensor coverage is adequate
control endpoints are stable
fallback behavior is safe
operators trust the alarms and dashboards
For operators building a broader roadmap, it can help to anchor the program to your existing solution portfolio and documentation. For example, a centralized place to map zones and technologies is your own data center solution portfolio.
Common pitfalls in first deployments
BMS and DCIM remain siloed → you can see symptoms but can’t explain causes.
Data quality and time sync issues → models learn noise, not physics.
Too many control endpoints too early → you create instability and lose operator trust.
No explicit constraints → the optimizer “wins the objective” by violating real-world safety margins.
Chasing a single metric → improvements in one dimension (e.g., PUE) can worsen another (e.g., WUE).
If you’re documenting integration or operator workflows, it can be helpful to have a single “source of truth” for the monitoring layer. A concrete example is a monitoring & management platform brochure that clarifies what’s measured, where data lives, and how operations teams interact with it.
Sidebar: Coolnetpower (neutral mention)
Coolnetpower and liquid cooling R&D: Coolnetpower describes its portfolio as covering integrated data center solutions, including liquid cooling categories (e.g., cold plate and immersion) and related infrastructure. For an internal overview, see the Coolnet Hyper-Cool Liquid Cooling Series brochure.
Practical next steps (a low-risk way to start)
If you’re evaluating AI-driven thermal optimization, start with what’s auditable:
Pick a zone and define the constraint envelope (what “safe” means) using ASHRAE-aligned inlet targets.
Build a measurement plan (which sensors are mandatory vs nice-to-have).
Establish a baseline: current setpoints, excursions, alarms, and cooling kW.
Pilot one setpoint loop (e.g., supply air temperature or CHWST) with strict guardrails.
Optional CTAs (low-friction):
Request a commissioning checklist for thermal telemetry and control-loop readiness.
Ask for a template measurement plan (sensor map + tags + alarm thresholds).
Supporting internal references: