AI thermal optimization tends to fail for one boring reason: the data isn’t usable.
Not “not enough data.” Not “we need a better model.” Usable—meaning you can trust timestamps, units, coverage, and control-path feedback enough to compare options and take safe action.
This post is a consideration-stage checklist to help you answer three questions before you start:
Do we have the right telemetry coverage?
Can we trust the quality and time alignment?
Can we integrate safely with BMS/DCIM/SCADA without turning the facility into a science experiment?
Key Takeaway: Treat AI thermal optimization as a controls + data-governance program. If you can’t prove your data lineage and time alignment, you can’t prove your results.
Table of Contents
ToggleQuick comparison: where the data comes from (and what each system is good at)
Most deployments blend multiple sources. The right approach depends on what you’re optimizing (room-level, row/rack, plant-level) and how much closed-loop control you want.
Option | What it is | Typical strengths | Typical gaps / risks | Best for |
|---|---|---|---|---|
BMS (Building Management System) | Building HVAC controls + environmental sensing | Direct access to HVAC setpoints, alarms, some environmental sensors | Rack-level coverage may be thin; IT load context often missing | Room/zone control, airside tuning |
DCIM | Facility + IT visibility (power, assets, environment) | Correlates IT load with facility signals; reporting and capacity context | May not own plant controls; can become “dashboard only” without control path | Cross-domain visibility + analytics |
SCADA | Industrial plant supervision (chillers, pumps, valves, CDUs) | Strong plant telemetry + actuation; mature alarm/event models | Can be isolated from IT data; integration effort can be heavier | Plant-level optimization and verification |
Data/telemetry layer (data lake / historian / time-series DB) | Normalized ingestion layer across systems | Enables consistent schemas, quality checks, retention, and ML features | Doesn’t magically fix bad sensors/timestamps; needs governance | Scaling analytics and model training |
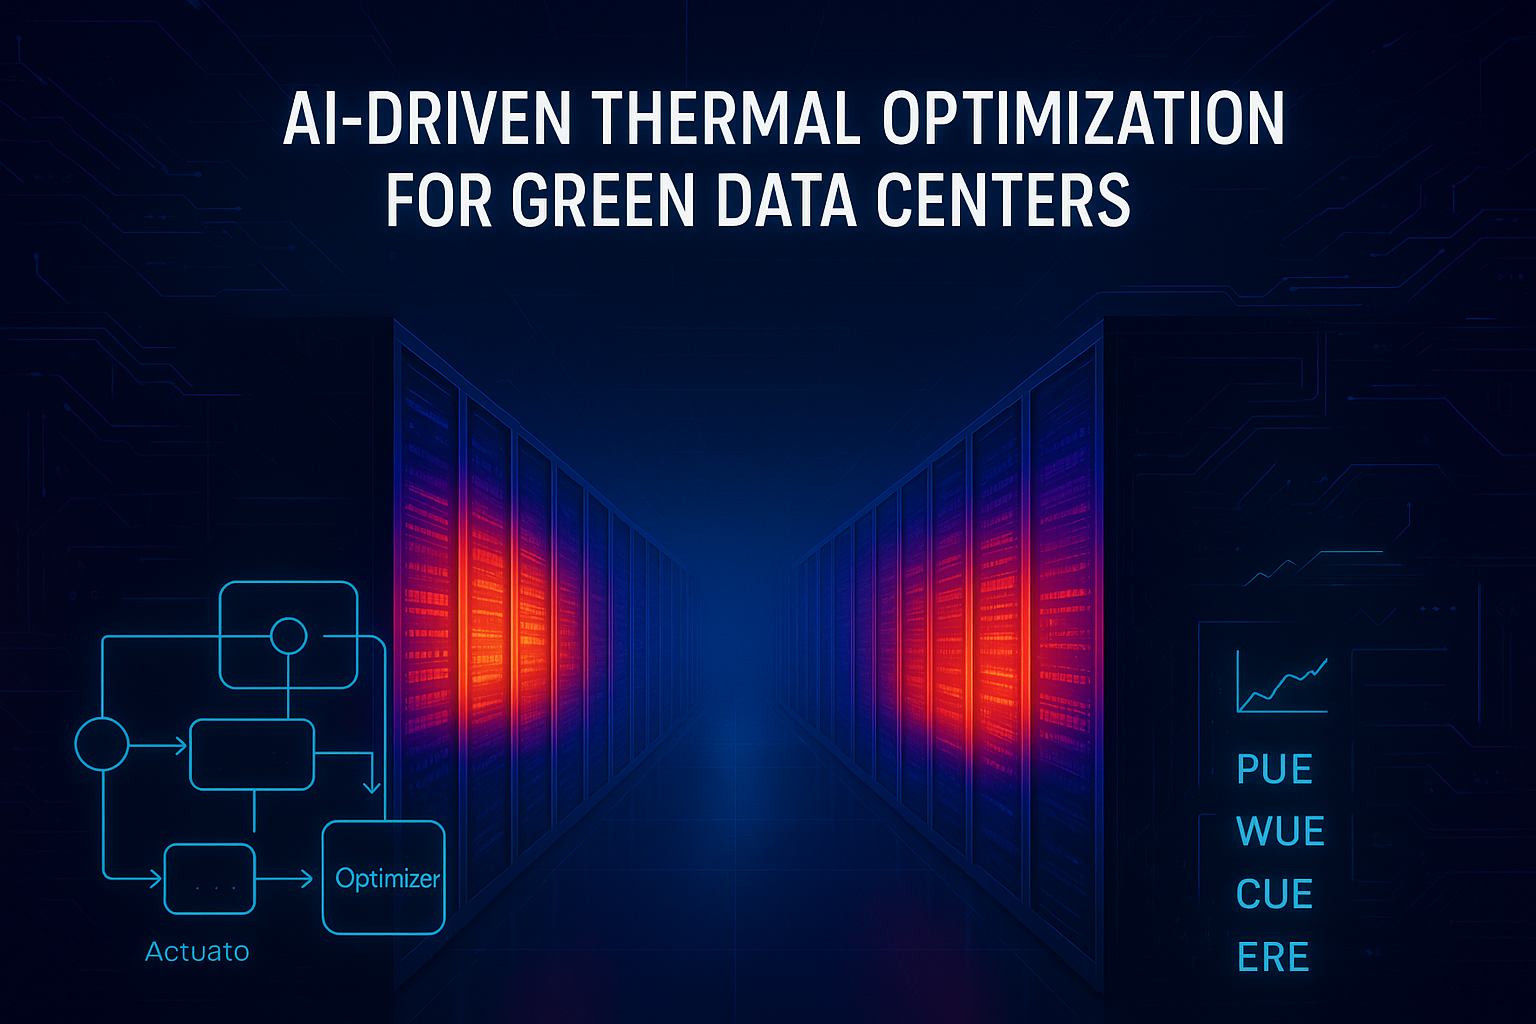
If you want a simple anchor point for “what AI thermal optimization is,” Coolnetpower frames it as closed-loop supervisory control driven by live telemetry and predictive models in Coolnetpower’s “AI-Driven Thermal Optimization for Green Data Centers”.
Checklist: data requirements for AI thermal optimization
Use this as a readiness gate. Each item is intentionally binary.
1) Sensor coverage checklist (do we measure what the model needs?)
Rack / row / room environment
Rack inlet temperature is measured at enough points to detect hotspots (not just “room temp”).
Relative humidity (or dew point) is captured for each relevant zone.
Airflow / pressure differential signals exist where containment or airflow management matters.
Sensors are tagged with location context (room/row/rack, side, elevation) and not just a device ID.
Cooling system and plant
Supply/return temperatures are measured for the circuits you intend to optimize (airside or waterside).
Fan/pump states (speed/VFD %, current draw, run status) are captured.
Valve/damper position feedback is captured (not just command signals).
Chiller/CDU operating states and alarms are captured in a way that can be correlated with thermal outcomes.
IT load and power
IT load proxy is available at a useful granularity (e.g., PDU/UPS power, per-row or per-rack kW).
Power telemetry includes units, phase context (if applicable), and consistent device identifiers.
Pro Tip: Don’t start with “every sensor everywhere.” Start with the zones where thermal risk and energy cost are highest, then expand coverage once your data QA passes.
2) Data quality checklist (can we trust the signals?)
Completeness and continuity
Each critical signal has a defined sampling interval and it’s actually met in production.
Missing data is monitored (not discovered during an incident).
You can distinguish “sensor offline” vs “value unchanged” vs “value unknown.”
Accuracy and calibration
Temperature and humidity sensors have a calibration policy (and evidence it’s followed).
You have documented sensor accuracy expectations for the signals you’ll optimize against.
Outliers and sanity checks
Outlier detection rules exist (e.g., impossible temperature jumps, negative flow, frozen values).
You can trace every data point back to a source system and tag.
Minimum history for baseline
You have enough historical data to capture normal operating variation (weekday/weekend, maintenance cycles, seasonal effects).
Historical data includes the same tags and units you’ll use going forward (no “old schema vs new schema” mismatch).
3) Integration checklist (BMS/DCIM/SCADA readiness)
System-of-record clarity
For each signal, you’ve defined the source-of-truth system (BMS vs DCIM vs SCADA vs meter).
You have a single canonical asset model (naming, IDs, locations) used across systems—or a mapping table that is maintained.
Read path (telemetry ingestion)
You can access required tags through a supported interface (vendor API, historian export, or gateway).
Ingestion method is documented (polling frequency, subscribe topics, rate limits, buffering).
Data is ingested with units and metadata, not just numbers.
Write path (setpoints and actuation)
You’ve defined which setpoints are in scope (and which are explicitly out of scope).
Every actuation has a safety envelope (min/max setpoints, rate-of-change limits).
You can verify actuation with independent feedback (e.g., valve position feedback and downstream temperature response).
Change management
Facilities and IT agree on a change window and rollback procedure.
You have a staging / shadow mode plan (observe-only before write-enabled).
4) Time synchronization checklist (does “now” mean the same thing everywhere?)
Time alignment is where “good-looking dashboards” become “bad optimization decisions.”
All systems produce timestamps in a common standard (UTC recommended) with explicit time zones where needed.
You know whether timestamps are generated at the source device, the gateway, or the collector.
Clock drift is monitored and alerting thresholds are defined.
NTP vs PTP selection (rule of thumb)
You’ve chosen a time sync strategy for OT + IT.
Where sub-millisecond alignment matters (OT/control), you’ve evaluated PTP (IEEE 1588) rather than relying on NTP alone.
For practical background, see Syncworks’ “PTP vs NTP” guide (2025) and L-P’s “NTP vs PTP” explainer (2025). Data center operators are also increasingly discussing PTP adoption; DataCenterKnowledge covered this shift in “PTP is the New NTP” (2026).
5) Retention and governance checklist (can we audit and reproduce results?)
You have a retention policy for each telemetry class (raw high-frequency vs aggregated).
Access control follows least privilege (who can read vs export vs modify mappings).
You can produce an audit trail of changes (tag mapping changes, schema versions, optimization rule changes).
You have a tiered storage plan (hot/warm/cold) sized to your data volume.
A useful mental model is tiered storage for operational telemetry—ClickHouse summarizes tradeoffs in its guidance on storing OpenTelemetry Collector data (2025), and OneUptime provides an implementation-oriented view in its tiered storage write-up (2026).
6) API and schema checklist (will integrations scale without constant rework?)
Schema basics
Every signal has:
asset_id,timestamp,value,unit, andquality_flag.Enums are explicit (e.g.,
status = on|off|fault, not0|1|2without a legend).Units are normalized and documented (°C vs °F, kW vs W, %RH vs dew point).
Metadata includes facility/zone context (room/row/rack), not only device IDs.
Versioning and change control
Schema changes are versioned and backward compatibility rules exist.
Tag/asset mapping changes are reviewed (PR-style) and logged.
Naming conventions
You have a consistent tag naming convention that encodes location + equipment + signal.
A tag database exists with descriptions, units, ranges, and owner.
If you need a reference point for “why a tag database matters,” the City of Tulsa’s “Tag Naming Standard” (PDF) is a concrete example of documenting tags, structure, and governance expectations.
7) Validation checklist (“done when” criteria before you enable optimization)
You can reproduce a thermal event timeline across systems (BMS + DCIM + SCADA) without manual timestamp fixing.
You can correlate IT load changes with thermal response at the intended granularity.
You have a baseline period with stable tags and stable schema.
You can run in observe-only mode and correctly predict hotspot risk (or temperature deltas) before taking any control action.
Rollback steps are documented and tested.
Sample telemetry maps (use these as a starting schema)
Below are examples you can adapt. The goal is to make integration conversations concrete: what tags, units, and sampling you expect.
Telemetry map A: Rack / row environmental signals
Field | Example tag | Unit | Suggested interval | Notes |
|---|---|---|---|---|
Rack inlet temp (top) |
| °C | 30–60s | Include sensor position metadata |
Rack inlet temp (mid) |
| °C | 30–60s | Helps detect stratification |
Rack inlet temp (bottom) |
| °C | 30–60s | — |
Zone humidity |
| %RH | 60s | Prefer dew point if available |
ΔP (cold→hot aisle) |
| Pa | 30–60s | Useful for containment validation |
Airflow (optional) |
| m/s | 30–60s | Use where airflow is controlled |
Telemetry map B: CRAH/CRAC (airside control)
Field | Example tag | Unit | Suggested interval | Notes |
|---|---|---|---|---|
Supply air temp |
| °C | 30–60s | Control target (within bounds) |
Return air temp |
| °C | 30–60s | Efficiency + load proxy |
Fan speed |
| % | 10–30s | Verify command vs feedback |
Coil valve command |
| % | 10–30s | Actuation |
Coil valve feedback |
| % | 10–30s | Required for closed-loop verification |
Alarm state |
| enum | event | Capture as event stream |
Telemetry map C: Chilled water / CDU (waterside)
Field | Example tag | Unit | Suggested interval | Notes |
|---|---|---|---|---|
CHW supply temp |
| °C | 10–30s | Plant-level optimization input |
CHW return temp |
| °C | 10–30s | ΔT monitoring |
CHW flow |
| L/s | 10–30s | If available |
Pump speed |
| % | 10–30s | VFD feedback |
CDU supply temp |
| °C | 10–30s | For liquid-cooled loops |
CDU return temp |
| °C | 10–30s | — |
Telemetry map D: IT power (load proxy)
Field | Example tag | Unit | Suggested interval | Notes |
|---|---|---|---|---|
Row power |
| kW | 30–60s | Correlate with thermal response |
Rack power |
| kW | 30–60s | Best when available |
UPS load |
| % | 60s | Coarser trend |
PDU breaker status |
| enum | event | Useful for state changes |
Optional: download the co-branded template pack (Coolnetpower)
If you want this checklist as a working document for facilities + IT, prepare a “Data Readiness Pack” that includes:
Excel/Google Sheet checklist (owners, due dates, evidence links)
CSV version for bulk import into ticketing tools
JSON schema pack (sample telemetry payloads + tag dictionary)
Printable PDF for commissioning walkdowns
You can also pair this with a DCIM layer to centralize the telemetry map; Coolnetpower’s DCIM – Data Center Infrastructure Monitoring and the Coolnet DCIM monitoring system PDF are useful starting points if you’re evaluating options.
FAQ
How many sensors do we need before AI thermal optimization is worth it?
Enough to observe thermal behavior at the level you want to control. If your goal is rack/row optimization, room-level sensors alone usually won’t be sufficient. Start with the highest-risk zones, prove data quality, then expand.
Do we have to integrate BMS, DCIM, and SCADA?
Not always. Many teams start with one system-of-record plus a telemetry layer, then add sources. The critical requirement is that your telemetry can be time-aligned and your actuation path (if any) can be verified.
How long should we retain high-frequency telemetry?
There’s no single right answer. A common pattern is to retain high-resolution data long enough to cover operational cycles and incident forensics, then downsample/aggregate for long-term trend analysis. What matters is that retention is explicit, enforced, and auditable.
Do we need PTP, or is NTP enough?
For many IT systems, NTP is adequate. For OT/control scenarios where precise event ordering and tight correlation matter, evaluate PTP (IEEE 1588) and instrument drift monitoring so you can prove your timestamps are trustworthy.
Next steps
If you’d like, download the “AI Thermal Optimization Data Readiness Pack” and use it to align facilities, IT, and compliance on the exact telemetry map and governance plan before you touch setpoints.
If you’re evaluating end-to-end options, Coolnetpower’s integrated approach—including AI-driven thermal optimization and DCIM—can be reviewed as one implementation path alongside your current BMS and plant controls.