One-sentence verdict: If you’re shortlisting a path to 30–80 kW/rack, the most defensible procurement decision isn’t “pick a cooling product”—it’s to pick a validated energy and risk model (PUE boundaries + metering plan) and then match architecture (air/RDHx/D2C) to density, climate, and operations readiness.
This review gives you procurement-ready artifacts: a five-year CapEx/OpEx model, climate-adjusted PUE benchmark bands (as ranges, not promises), a spares matrix, and a 3‑year upgrade roadmap.
Where it helps SEO and searchability, we also use the term data center retrofit TCO model—because that’s effectively what you need once you’re moving beyond ~30 kW/rack in mixed-density halls.
Key Takeaway: Treat PUE as a measured outcome inside a defined boundary, not a spec sheet number. A good model plus good validation beats an aggressive claim every time.
Table of Contents
ToggleWho this is for (and who it isn’t)
This is for you if you’re:
Planning 30–80 kW racks for AI/HPC or other high-density workloads and need an audit-friendly way to compare options.
Managing mixed-density rooms where “one cooling strategy everywhere” isn’t realistic.
Being asked to justify decisions in terms procurement understands: 5‑year TCO, risk, and upgradeability.
This is not for you if you’re:
Still determining whether you need high-density at all (start with baseline metering and heat‑map work first).
Looking for a single universal PUE number—real facilities don’t behave that way.
Assumptions and boundaries (so your numbers stay comparable)
Before any TCO or PUE comparison is meaningful, write down these assumptions in plain language:
Measurement boundary: What’s included in “facility energy” vs “IT energy”? Use a consistent definition aligned to ISO/IEC 30134 style boundary discipline (and document it).
Load profile: Average IT load vs peak load. PUE usually looks worse at low utilization because fixed overhead doesn’t scale down linearly.
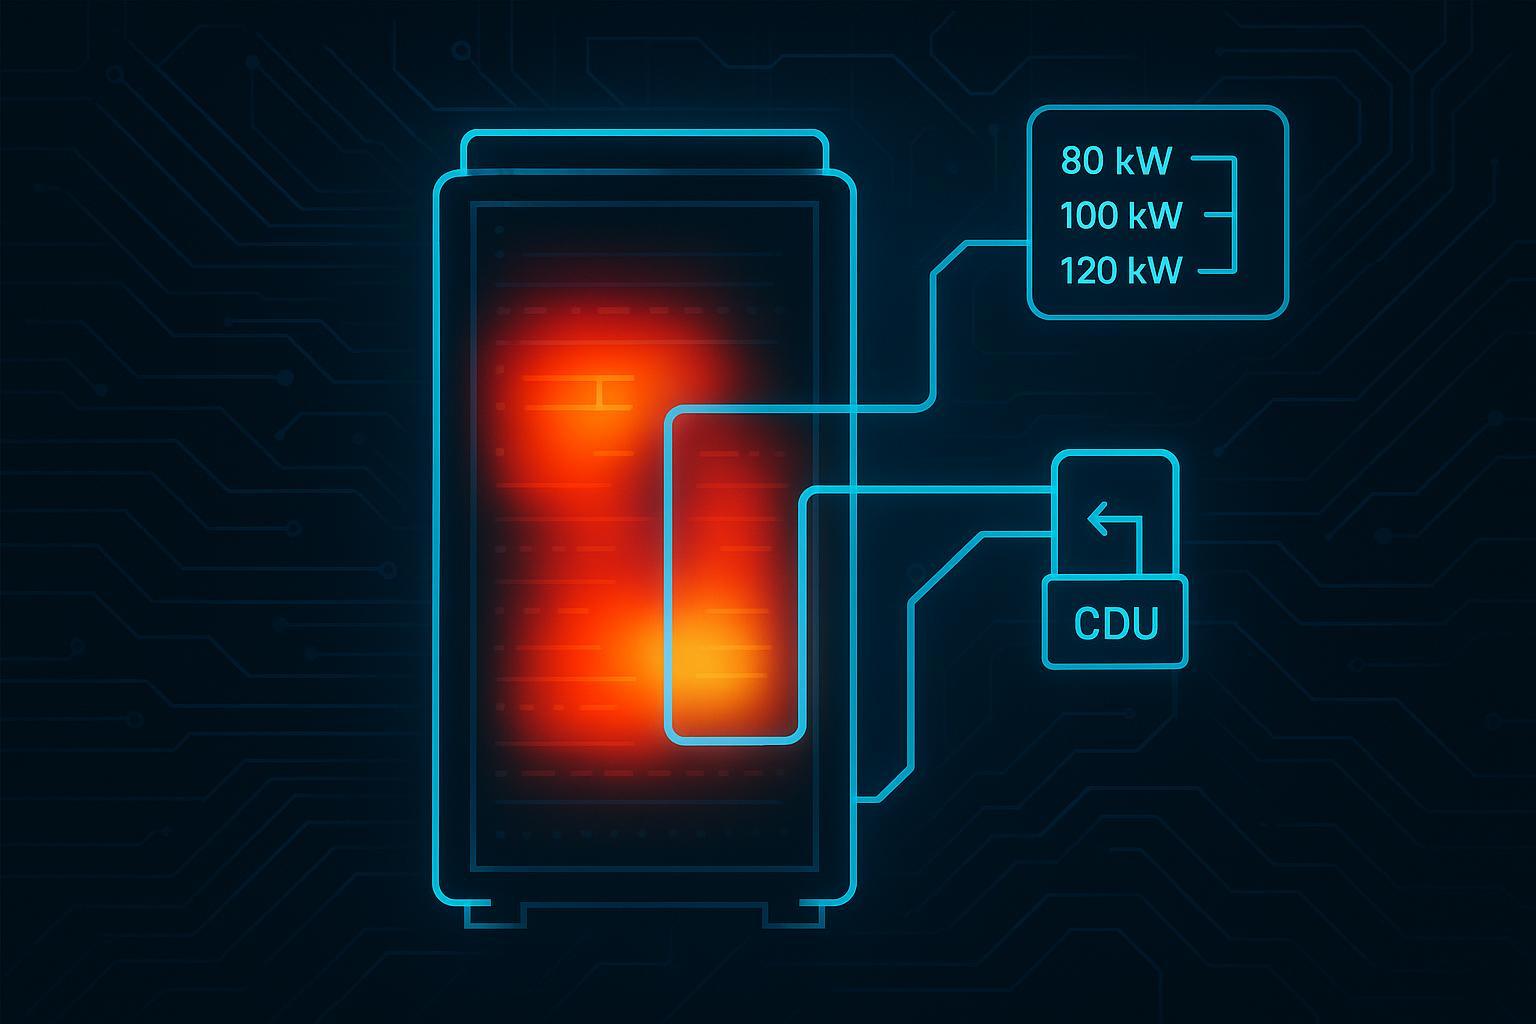
Rack envelope: For each row/zone, record max kW, expected steady-state kW, and a realistic growth factor.
Losses and safety factors: For sizing, you need credible loss bands and headroom.
From Coolnetpower’s sizing guidance for 30–80 kW racks, typical planning ranges you should explicitly document include PDU losses (~1%–3%), UPS losses (~2%–6%), and cooling safety factors (roughly 1.10 for stable, well-instrumented loads and 1.20–1.30 when growth/variability is high) as described in Sizing power and cooling for high-density AI racks (30–80 kW).
⚠️ Warning: “Rated capacity” does not guarantee heat removal. Bypass/recirculation, containment leakage, and controls tuning can erase theoretical advantages.
Climate-adjusted PUE benchmarks (use as ranges, not promises)
Use the table below as a starting benchmark band for discussion and sensitivity analysis—not as a target you can guarantee without validation.
Two discipline points:
Climate matters, but control strategy + load level + boundary often matter more than people admit.
Compare like with like: Uptime Institute cautions that PUE is best for tracking efficiency over time within a facility; the industry-wide average is still much higher than elite sites. In 2023, Uptime Institute reported an industry-average PUE of 1.58 and noted that larger facilities tend to be more efficient (capacity-weighted average 1.47) in Large data centers are mostly more efficient, analysis confirms.
Benchmark table: PUE bands by climate and load profile (illustrative)
Climate class | If you have strong economizer hours + tight airflow QA | If economizer hours are limited / humidity control is heavy | Notes you must document |
|---|---|---|---|
Cool/temperate | ~1.15–1.30 | ~1.25–1.40 | Boundary definition, redundancy mode, and load factor can swing results materially |
Hot-dry | ~1.20–1.35 | ~1.25–1.45 | Evaporative vs dry heat rejection changes both PUE and water risk |
Hot-humid | ~1.25–1.45 | ~1.35–1.55 | Dehumidification and limited free cooling are the dominant penalty |
Mixed/seasonal | ~1.20–1.40 | ~1.25–1.50 | You should model seasonal operation (lockouts, shoulder seasons, tuning drift) |
For a practical checklist on setting and verifying targets (including boundaries, normalization, and evidence packs), use Realistic PUE/WUE targets for mixed-density (checklist).
5-year TCO for 30–80 kW AI racks: the model you can defend
This section gives you a model structure you can take into procurement reviews. It’s built to support three energy-price scenarios (low/medium/high) and to keep assumptions explicit.
Step 1 — Define the zone and the unit of comparison
Pick a unit that procurement understands and engineering can validate:
Per rack (30/40/60/80 kW envelope), or
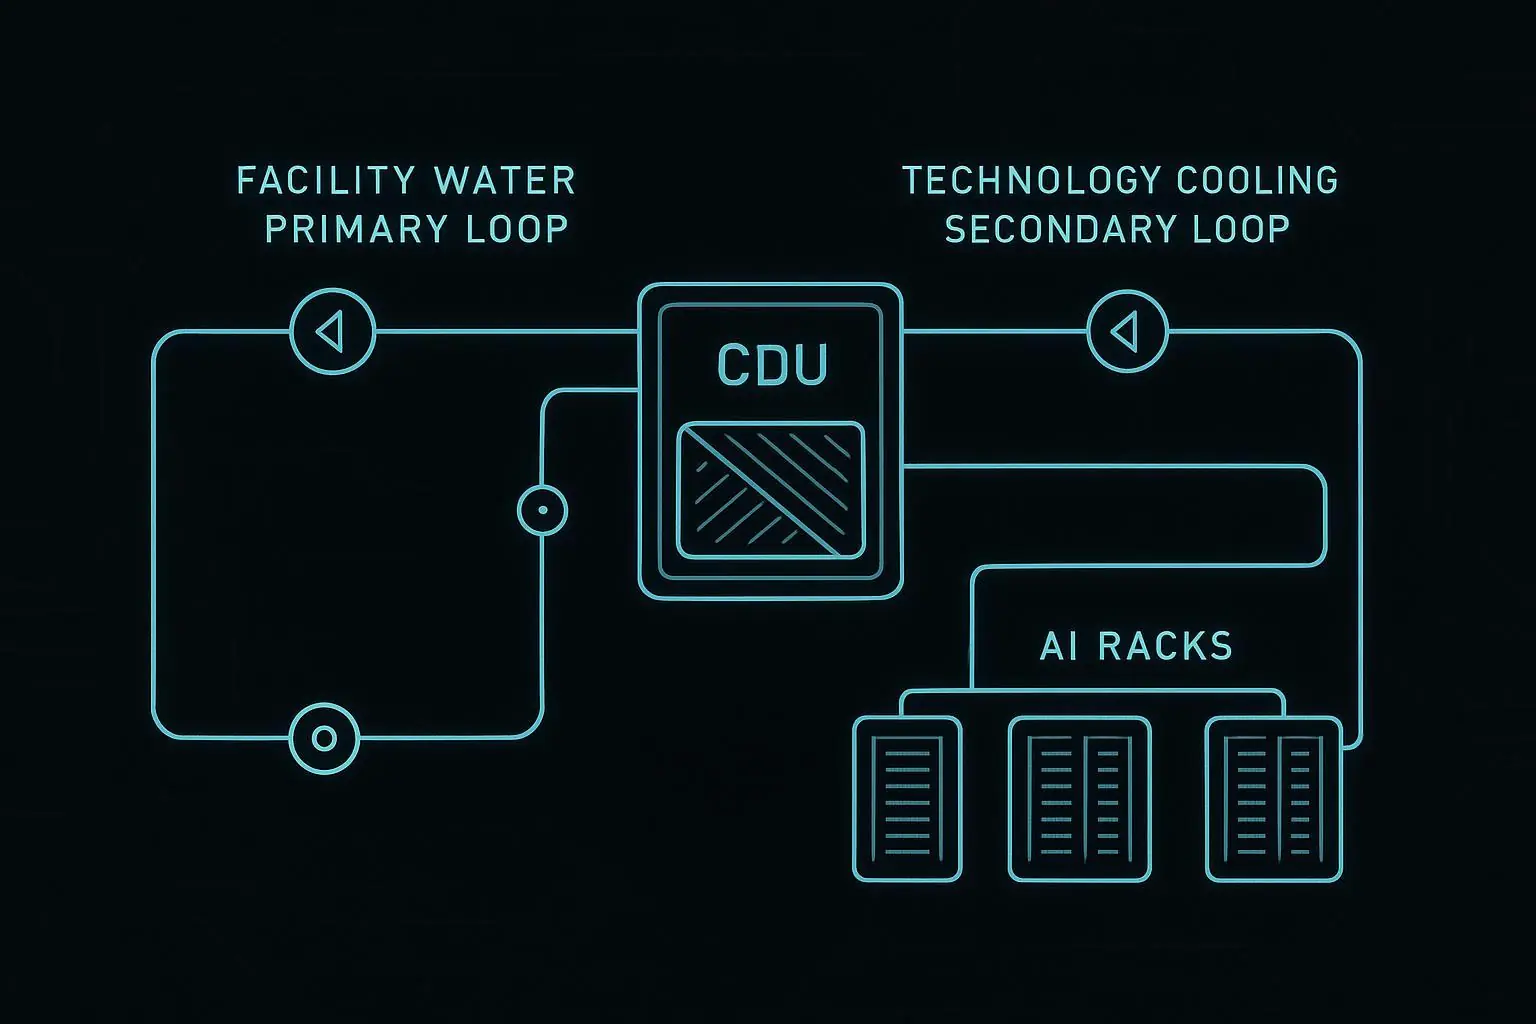
Per “AI pod” (e.g., N racks sharing a CDU/loop), or
Per MW of IT load.
Step 2 — CapEx categories (what you buy once)
Use consistent categories across air/RDHx/D2C so the comparison isn’t biased.
CapEx category | What it includes (examples) | Notes |
|---|---|---|
Cooling equipment | Containment upgrades, RDHx doors, CDUs, manifolds, sensors | Avoid comparing “air only” vs “liquid including controls”; normalize scope |
Mechanical + piping | Valves, hoses/quick connects, insulation, secondary loops | Retrofit complexity is often here—not in the headline equipment price |
Electrical + controls | Power feeds, panel work, control integration, alarms, BMS hooks | Integration quality strongly affects real outcomes |
Commissioning + training | Functional tests, acceptance criteria, staff runbooks | Treat commissioning as risk reduction, not overhead |
Coolnetpower’s ROI/TCO retrofit framework uses this same “inputs first, categories explicit” discipline and provides a practical structure and formula examples in Data center cooling retrofit ROI: estimate TCO.
Step 3 — OpEx categories (what you pay every year)
3.1 Energy OpEx: convert PUE into dollars (three scenarios)
At a high level:
Annual facility energy (kWh) ≈ IT kW × PUE × 8,760
Annual energy cost ($) ≈ annual kWh × $/kWh
Build three scenarios:
Scenario | $/kWh assumption | When to use |
|---|---|---|
Low | (set by you) | long-term contracted power or low-cost regions |
Medium | (set by you) | typical enterprise blended rate |
High | (set by you) | constrained sites, peak pricing exposure, or risk‑weighted forecasts |
If demand charges are material for your site, model them as a separate sensitivity rather than hiding them inside $/kWh.
3.2 Maintenance OpEx: what changes with architecture
Model maintenance as “avoided + added,” not as a vague percentage.
Maintenance bucket | Often reduced in hybrid/liquid zones | Often added in hybrid/liquid zones |
|---|---|---|
Air-side work | filter and fan churn, hotspot investigations, rebalancing | residual air handling still exists in many hybrids |
Liquid-side work | — | pump checks, fluid sampling, sensor calibration, leak-response drills |
Step 4 — Refresh and upgrade costs (don’t ignore the density step-change)
High-density deployments rarely stay static for five years. Plan for:
A mid-cycle power growth event (e.g., the next GPU generation) and
The cost of instrumentation/controls upgrades needed to keep operations stable.
If you need a practical starting point for engineering teams, treat this as a high-density rack cooling 30 kW 60 kW 80 kW planning exercise: validate the envelope at each step-change and force every assumption into a measurable boundary.
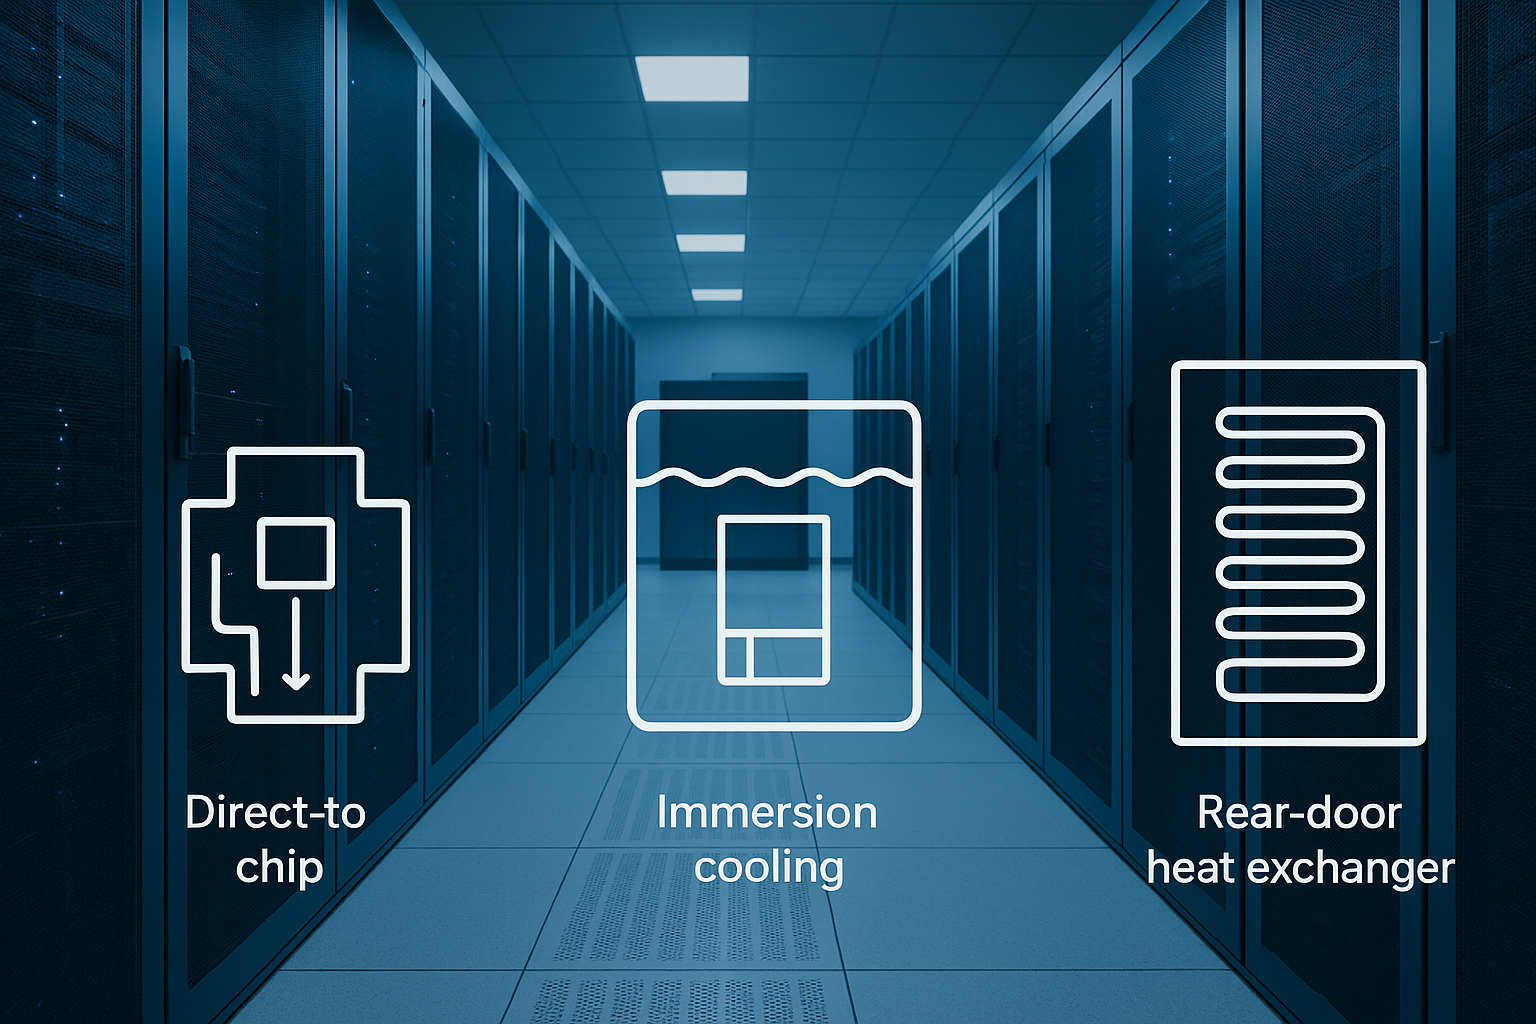
Rear-door heat exchanger vs direct-to-chip liquid cooling (and air) at 30–80 kW
There isn’t one “best” architecture across the full 30–80 kW band. The right answer depends on density headroom, retrofit tolerance, and your operations model.
Quick decision matrix (procurement-friendly)
Dimension | Air containment / CRAH-CRAC | RDHx (rear-door) | Direct-to-chip (single-phase) |
|---|---|---|---|
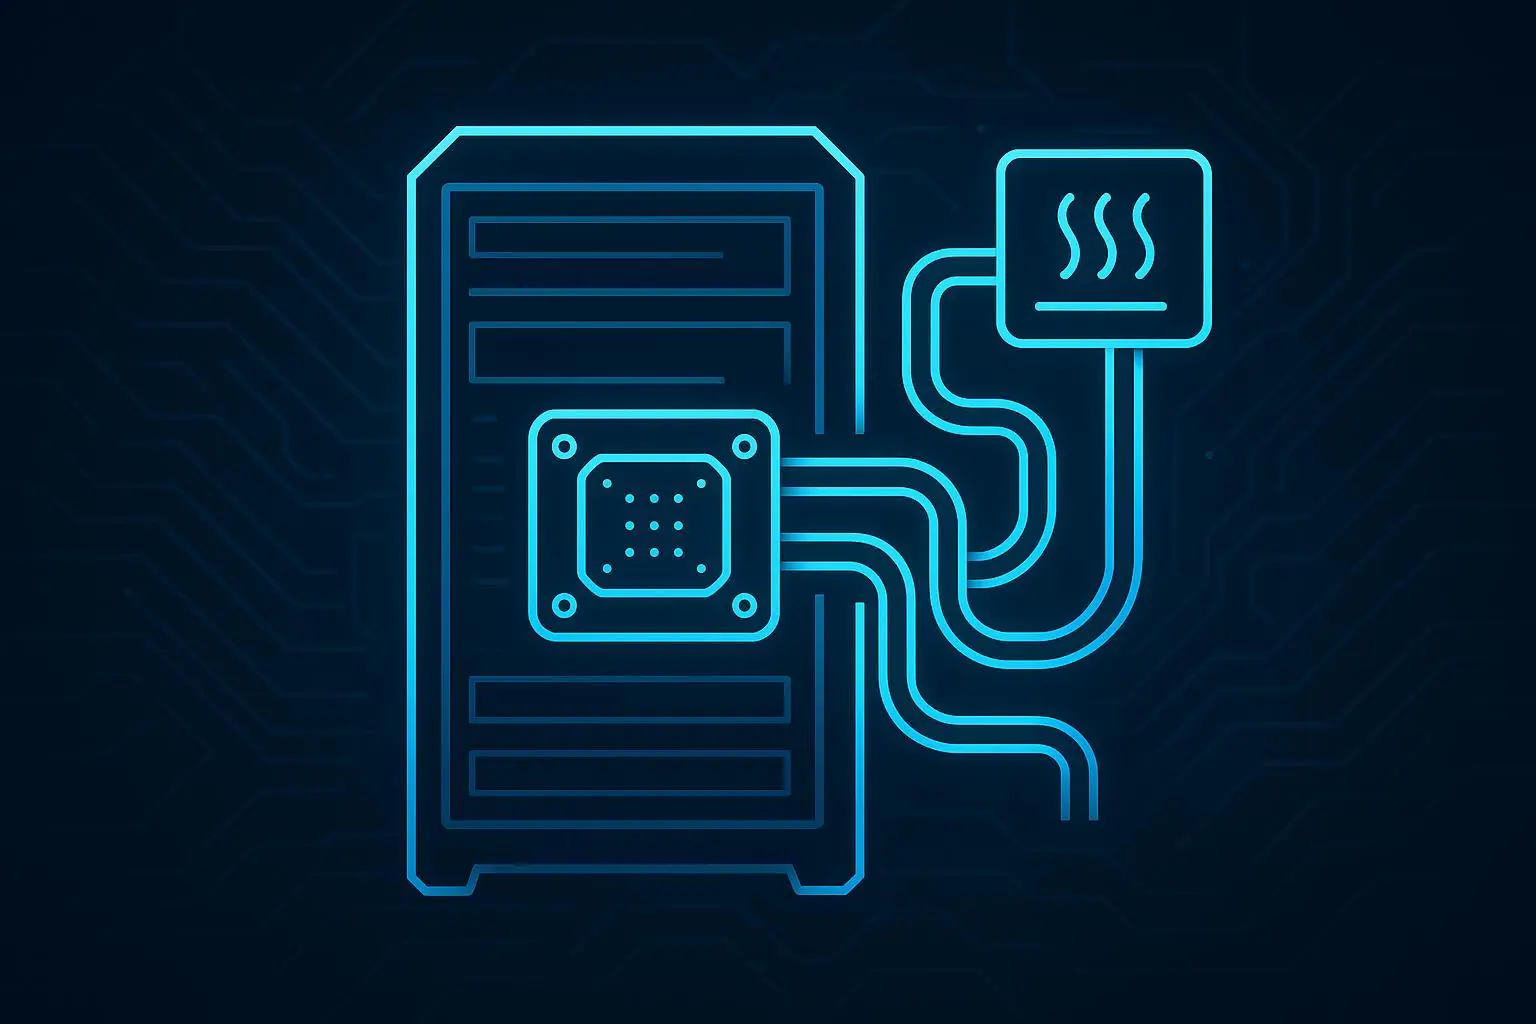
Practical density band | Best below the upper end of 30–40 kW | Strong for ~40–55 kW; can stretch higher in some conditions | Durable path as you approach the upper end of 60–80 kW and beyond |
Retrofit downtime risk | Low–medium (depends on containment + controls scope) | Low (rack-by-rack) | Medium–high initially; manageable with phased pods |
Integration complexity | Low–medium | Low–medium | Medium–high (CDU/manifolds/cold plates + training) |
O&M readiness needed | Standard airflow operations | Adds liquid loop discipline (QDs, valves, alarms) | Highest (leak detection, liquid maintenance workflows, training) |
Water strategy impact | Depends on plant; evaporative changes WUE | Can be near-zero WUE with dry coolers | Can be near-zero WUE with dry coolers; warm-water improves heat rejection |
Upgrade headroom | Limited once you hit airflow/fan limits | Good bridge path; headroom tightens above mid-band | Best long-term headroom and heat-reuse optionality |
For a deeper comparison including maintainability and redundancy patterns, see Rear‑door vs in‑row vs direct‑to‑chip retrofit comparison.
Coolnetpower cost model (what to put in your spreadsheet)
A procurement-ready model is just a set of explicit inputs and formulas. Here’s a structure you can use immediately.
Inputs (fill these per zone)
IT load: average kW and peak kW
Baseline PUE and modeled PUE band (by climate + architecture)
Energy price scenarios: low/medium/high ($/kWh)
Demand charge sensitivity (optional)
CapEx by category (cooling equipment; mechanical/piping; electrical/controls; commissioning/training)
Annual maintenance delta (avoided air-side + added liquid-side)
Spares inventory policy (see next section)
Refresh/upgrade allowance (3-year roadmap section)
Outputs
5-year cumulative cost (CapEx + OpEx)
Sensitivity table: which variable moves the result most (often PUE delta and $/kWh)
Risk notes: downtime exposure, skills gap, and validation plan
Spares matrix (framework-only, no SLA numbers)
Spares should be driven by criticality and restoration path, not a generic “keep one of everything.” Use three tiers:
Tier 1 (must restore quickly): failure stops the zone or forces derating.
Tier 2 (important but manageable): failure reduces redundancy or efficiency.
Tier 3 (convenience): failure is annoying but doesn’t threaten operations.
Example spares matrix (adapt to your standards)
Subsystem | Typical failure modes | Criticality tier | Recommended sparing approach | Notes |
|---|---|---|---|---|
Power chain (UPS/PDU components) | breaker wear, module failure, sensor failure | 1 | on-site for common modules; vendor-held for large assemblies | Tie sparing to your redundancy design (N+1 vs 2N) |
Airflow/containment | fan arrays, containment seals, door sensors | 2 | on-site kits (seals, sensors, a small fan set) | Leakage control is an efficiency multiplier |
RDHx loop | quick disconnects, valves, door fans, small leaks | 1–2 | on-site QD/valve kits; isolation capability; leak response supplies | Design for isolation and hot-serviceability |
D2C loop (CDU/manifolds) | pump failure, sensor drift, flow restriction | 1 | on-site pump/sensor kits; vendor-held CDU assemblies | Treat training/runbooks as part of “spares readiness” |
Controls & monitoring | probes, flow/pressure sensors, gateways | 1–2 | on-site sensor spares; standardized replacements | Without data, you can’t prove PUE/TCO changes |
3-year upgrade roadmap (30 → 80 kW without rewrites)
A 3-year roadmap is where many 5-year models fail. Use it to prevent “upgrade shock.”
Time horizon | What changes | What you should pre-plan now |
|---|---|---|
0–6 months | Initial deployment at 30–40 kW zones | Metering boundaries, heat map, containment QA, and a baseline evidence window |
6–18 months | First density push (40–60 kW pockets) | Add hybridization (RDHx) where retrofit tolerance is low; build liquid-ready operations (alarms, isolation, drills) |
18–36 months | GPU/platform refresh drives 60–80 kW sustained in hot zones | Expand D2C in the highest-density pods; ensure CDU redundancy patterns, spares policy, and training are in place |
What to validate before signing (site survey / PoC checklist)
Use this as a gating checklist for procurement and engineering sign-off:
PUE boundary diagram: meters and what’s included/excluded.
Baseline data window: at least one meaningful operating window that represents your normal load.
Climate normalization: document economizer lockouts and humidity constraints.
Architecture fit: confirm density headroom and retrofit phasing plan.
Operations readiness: runbooks, escalation path, training plan for liquid loops.
Spares policy: tiering + where spares are held + evidence of restore workflow.
Upgrade triggers: define what conditions force RDHx→D2C expansion.
Next steps
If you want, we can turn your actual site inputs into a decision-ready worksheet:
Request the 30–80 kW rack TCO worksheet + metering checklist (so your team can plug in your PUE boundary, tariffs, and density plan).
Or book a technical fit call to review retrofit phasing (air → RDHx → D2C) and what to validate before purchase.