Edge AI sites don’t give you much slack: limited utility capacity, limited mechanical space, and racks that can jump from 30 kW to 80 kW as GPU generations change. If you undersize, you get throttling, nuisance trips, and emergency retrofits. If you oversize, you buy capacity you can’t use.
This guide is a practical sizing workflow you can hand to facilities, IT, and procurement. It includes copy/paste calculators, a rack heat-map template, and redundancy/autonomy scenarios.
Table of Contents
ToggleWhat you’ll be able to size (outputs)
By the end you’ll have:
A per-rack and per-site power budget (kW and kVA) with loss assumptions.
A cooling capacity target (kW, tons, and water-side flow where applicable).
A redundancy position (N, N+1, 2N) with a simple scenario matrix.
A rack-level heat map and sensor plan to validate reality after install.
Inputs you need (prerequisites)
Gather these before you start:
Planned rack nameplate power (or measured draw) for the AI nodes.
Expected utilization profile (steady-state training, bursty inference, mixed).
Allowed rack inlet temperature range and site ambient constraints.
Utility feed limits (kW), available voltage, and any generator constraints.
Space and routing constraints for airflow containment and/or liquid piping.
Availability target (and what “maintenance without downtime” means for your site).
Key Takeaway: For sizing, treat IT kW as heat kW, then add the losses and constraints that matter at the edge: power-chain losses, distribution limits, and redundancy.
Step 1 — Define the rack power envelope (and what “30–80 kW” really means)
Start with three numbers per rack:
Design max (kW): the ceiling you want the rack to support without redesign.
Expected steady-state (kW): what you’ll actually run most of the time.
Step-change risk: how likely the rack is to grow 20–30% after the first refresh.
For edge AI, the design max often matters more than the average, because you can’t “borrow” chilled water or spare electrical capacity from a large central plant.
Quick worksheet
Use these fields for each rack:
Rack_IT_kW_max = ____Rack_IT_kW_avg = ____Growth_factor = 1.__(example: 1.2 for 20% headroom)
Then:
Rack_IT_kW_design = Rack_IT_kW_max × Growth_factor
If you only have kVA ratings, convert to kW using power factor:
kW = kVA × PF
Step 2 — Convert IT power into a heat-load model (kW ↔ BTU/hr)
For sizing, almost all electrical power consumed by IT becomes heat in the space. That means rack IT kW is your starting point for rack heat kW.
Calculator: kW to BTU/hr
Use the standard conversion from RapidTables’ kW to BTU/hr reference:
Rack_heat_BTU_per_hr = Rack_IT_kW_design × 3412.142
Example:
50 kW rack →
50 × 3412.142 ≈ 170,607 BTU/hr
Add “non-IT” heat that shows up in edge rooms
In an edge micro data center, losses can be a non-trivial share of the thermal burden.
Use a simple additive model:
Total_site_heat_kW = IT_kW + UPS_loss_kW + PDU_loss_kW + lighting_kW + misc_kW
Typical placeholders (replace with vendor data where you have it):
PDU_loss_kW ≈ IT_kW × 0.01 to 0.03(depends on distribution design and loading)UPS_loss_kW ≈ IT_kW × 0.02 to 0.06(depends on topology and loading)
Pro Tip: When your UPS is lightly loaded (common at the edge early in deployment), efficiency drops. If you size redundancy aggressively but run low utilization, validate the loss assumptions.
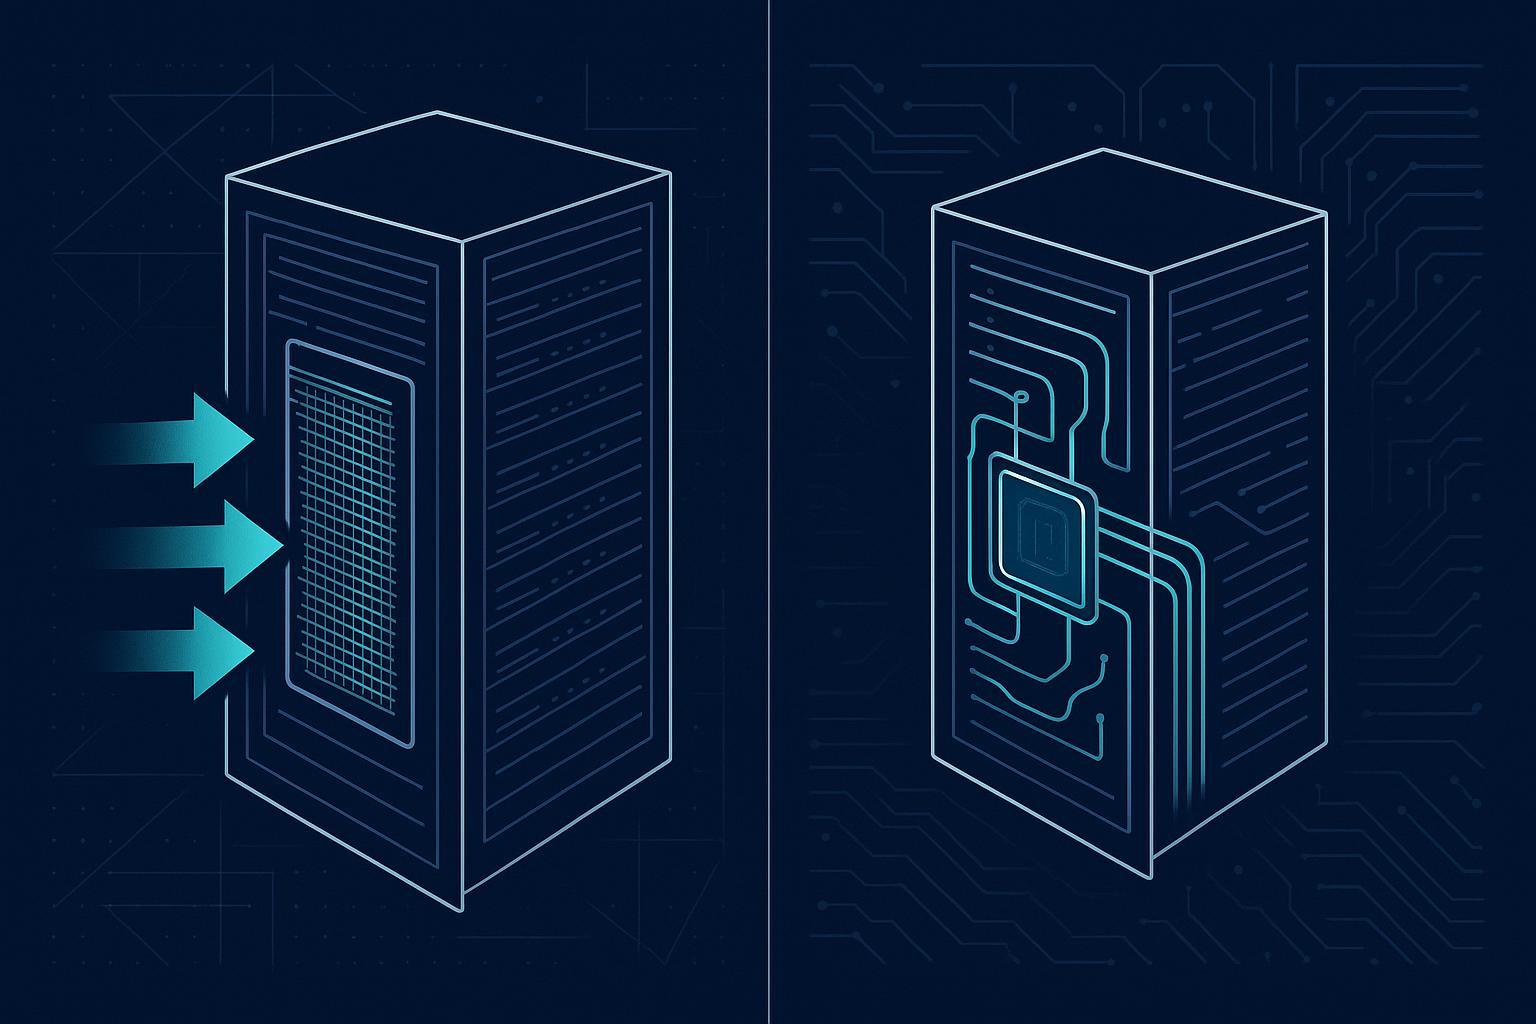
Step 3 — Pick a cooling distribution architecture that matches edge constraints
High-density racks fail in edge sites for one reason more than any other: you can’t deliver cooling where the heat is.
Use this decision logic:
Option A: Air cooling with containment (works when airflow is the bottleneck you can solve)
Use when:
Rack density is at the low end of “high” for your space (often 30–40 kW with strong containment and close-coupled units).
You can implement containment and eliminate bypass/recirculation.
Watch-outs:
Fan power and noise.
Local hot spots when the load is uneven (common for mixed GPU/CPU racks).
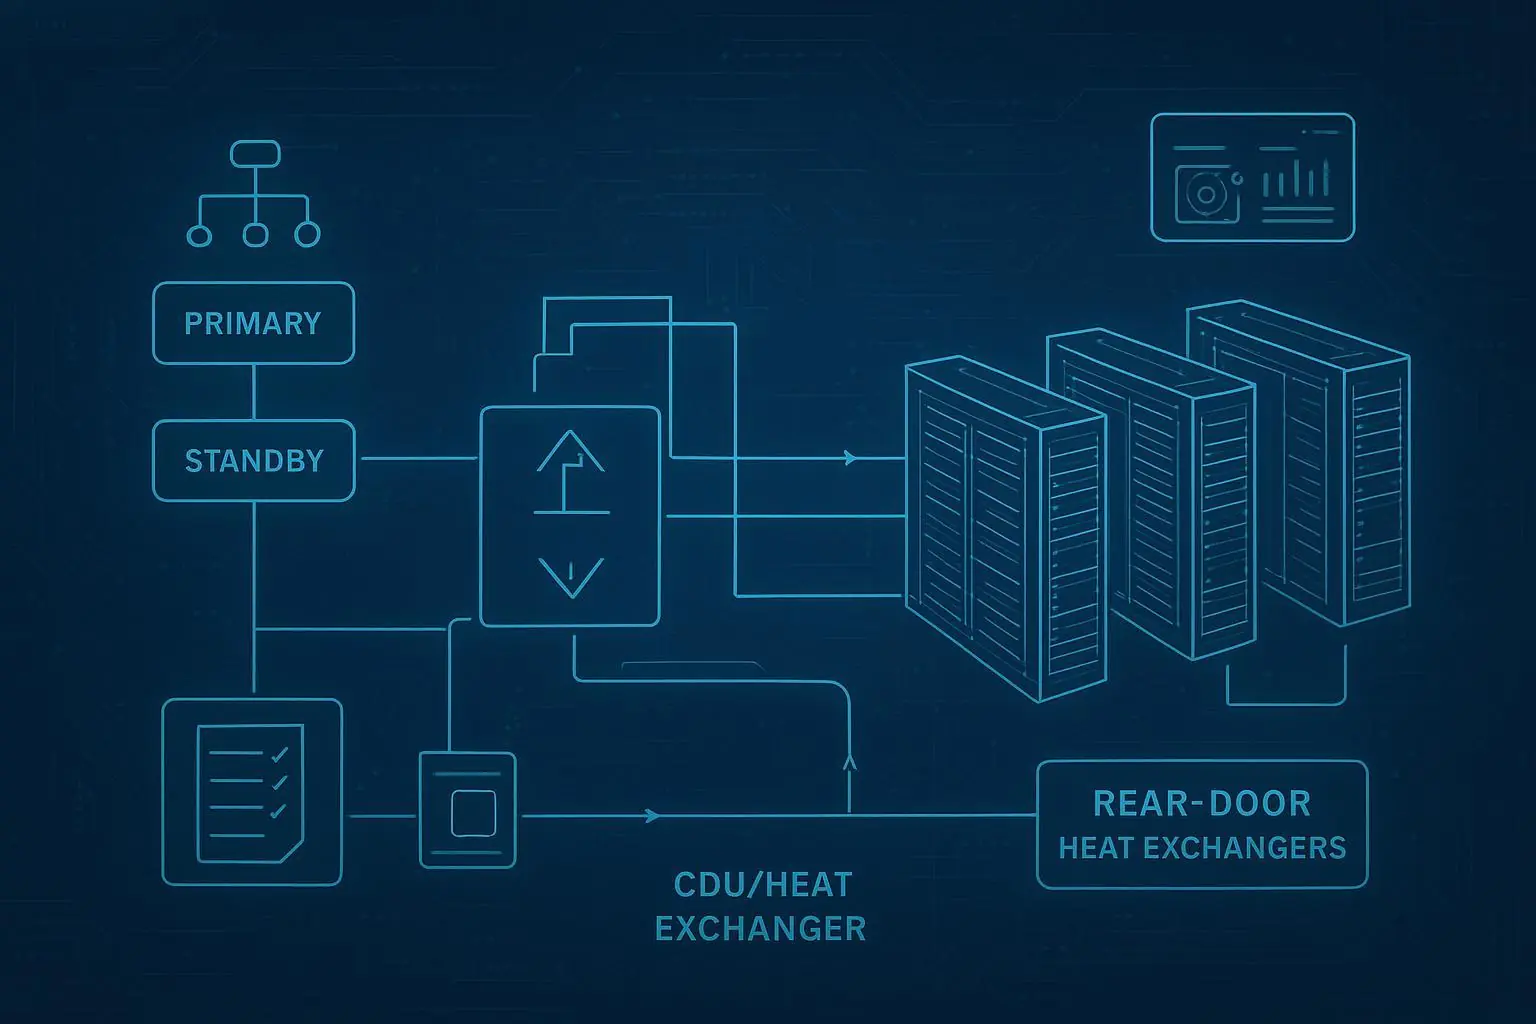
Option B: Hybrid (rear-door HX, in-row + water-side assist)
Use when:
You need a retrofit-friendly path to higher density without full direct-to-chip plumbing.
You want to remove a large fraction of heat at the rack boundary and reduce room delta-T sensitivity.
Watch-outs:
Water-side capacity and condensation controls.
Service access and door weight/clearance.
Option C: Liquid cooling (direct-to-chip or immersion)
Use when:
You’re targeting sustained 50–80 kW racks with limited mechanical air-side headroom.
You have a clear approach to leak detection, quick disconnects, and maintenance workflows.
Watch-outs:
Facility water quality, filtration, and commissioning discipline.
Redundancy design for pumps/heat exchangers.
Step 4 — Size the cooling capacity and delivery (calculator blocks)
You’re sizing two things:
Capacity (kW you must remove)
Delivery (airflow or coolant flow that actually moves that heat)
4A) Cooling capacity target (kW)
Start with:
Cooling_capacity_kW_target = Total_site_heat_kW × Safety_factor
Common safety factors:
1.10 for well-instrumented, stable loads
1.20–1.30 for early deployments with uncertain growth and uneven load mapping
4B) “Sanity check” airflow requirement (air-cooled or hybrid rooms)
Even if you’re going liquid-first, this check catches common planning errors (like assuming the room can still carry heat during a partial liquid failure).
Convert site heat to BTU/hr:
Site_BTU_per_hr = Total_site_heat_kW × 3412.142
Use a temperature rise assumption (ΔT) across the room airflow path.
A practical starting point:
ΔT_F = 20 to 30°F(tighter ΔT means more airflow)
Then estimate airflow:
CFM ≈ Site_BTU_per_hr / (1.08 × ΔT_F)
This is an engineering approximation used for planning. Your real constraint is containment quality and where the air actually goes.
4C) Water-side sizing (for hybrid and liquid systems)
For water-side planning, what matters is the temperature approach you can run without condensation risk and with the plant you have.
Define:
Q_kW= heat to remove (kW)ΔT_water_C= supply-to-return rise on the water loop
Then the required mass flow is proportional to Q / ΔT.
If you keep the calculation in a simple worksheet, use this structure:
Choose a target
ΔT_water_C(example: 5–10°C depending on loop design)Compute required flow from your preferred units and reference tables
If you need a procurement-ready deliverable, the key is not the exact constant. It’s the consistent assumptions and the ability to validate that your plant can hold setpoint under peak.
Step 5 — Size power and cooling together at the site level (utility → UPS → PDU → rack)
At the edge, the power chain fails in three predictable places:
upstream capacity limits (utility feed or generator)
distribution constraints (breakers, cables, voltage)
protection coordination and nuisance trips during transient spikes
5A) Start with IT kW, then add losses
Use a simple loss model:
Facility_power_kW = IT_kW / (UPS_eff × PDU_eff × other_eff)
If you don’t have efficiencies yet, use a conservative additive approximation:
Facility_power_kW ≈ IT_kW × (1 + UPS_loss% + PDU_loss% + misc%)
5B) Convert kW to kVA for electrical equipment sizing
Many upstream components are sized in kVA.
kVA = kW / PF
If you don’t know PF, treat it as a parameter and run sensitivity:
PF = 0.9 and PF = 1.0 scenarios
5C) Oversubscription and diversity
Edge sites often deploy in phases. If you’re planning oversubscription, write it down as a policy, not a hope:
What load types can be curtailed?
What happens during a failover event?
⚠️ Warning: Don’t size upstream gear on average kW if you have GPU racks with large, fast step loads. Coordinate with the OEM or measure real transients where possible.
Step 6 — Redundancy and autonomy: N vs N+1 vs 2N (with scenarios)
Redundancy is not a badge. It’s a statement about what failures you can survive without violating your thermal and electrical limits.
Define what must stay up
For each edge site, state:
Must-run IT load (kW)
Allowed degradation mode (inference only, shed training, throttle)
Max allowed thermal excursion duration
Redundancy patterns
N: exactly enough capacity to meet peak load
N+1: one extra module/unit beyond what is required
2N: two independent paths, each capable of carrying the full load
Copy/paste scenario matrix (fill with your numbers)
Scenario | IT load (kW) | Cooling path | Power path | What fails? | What stays within limit? | What you must verify |
|---|---|---|---|---|---|---|
Baseline |
| Normal | Normal | None | Rack inlet temps, breaker loading | Sensors, BMS/DCIM, PDU telemetry |
Single cooling unit down |
| N+1 carries | Normal | 1 CRAH/in-row unit | Inlet temps remain in spec | Remaining unit capacity, containment leakage |
Single pump/CDU down |
| Redundant pump/CDU | Normal | 1 pump/CDU | Flow and delta-T remain in spec | Control logic, alarms, auto-bypass |
Utility outage |
| Normal (or degraded) | UPS + genset | Utility feed | Runtime to genset, fuel policy | Transfer time, battery autonomy |
Generator unavailable |
| Degraded | UPS only | Genset | Minimum safe runtime | IT shedding policy |
One power path down (2N) |
| Normal | alternate path | PDU/UPS path A | No overload on path B | Breaker/cable ratings, coordination |
Autonomy calculator (UPS + generator)
Define:
Critical_IT_kW = ____Total_critical_kW = Critical_IT_kW × (1 + loss%)Battery_energy_kWh_available = ____
Then:
Battery_runtime_hours ≈ Battery_energy_kWh_available / Total_critical_kW
This gives a planning estimate. Procurement should require a runtime spec at the actual load level, not just a brochure number.
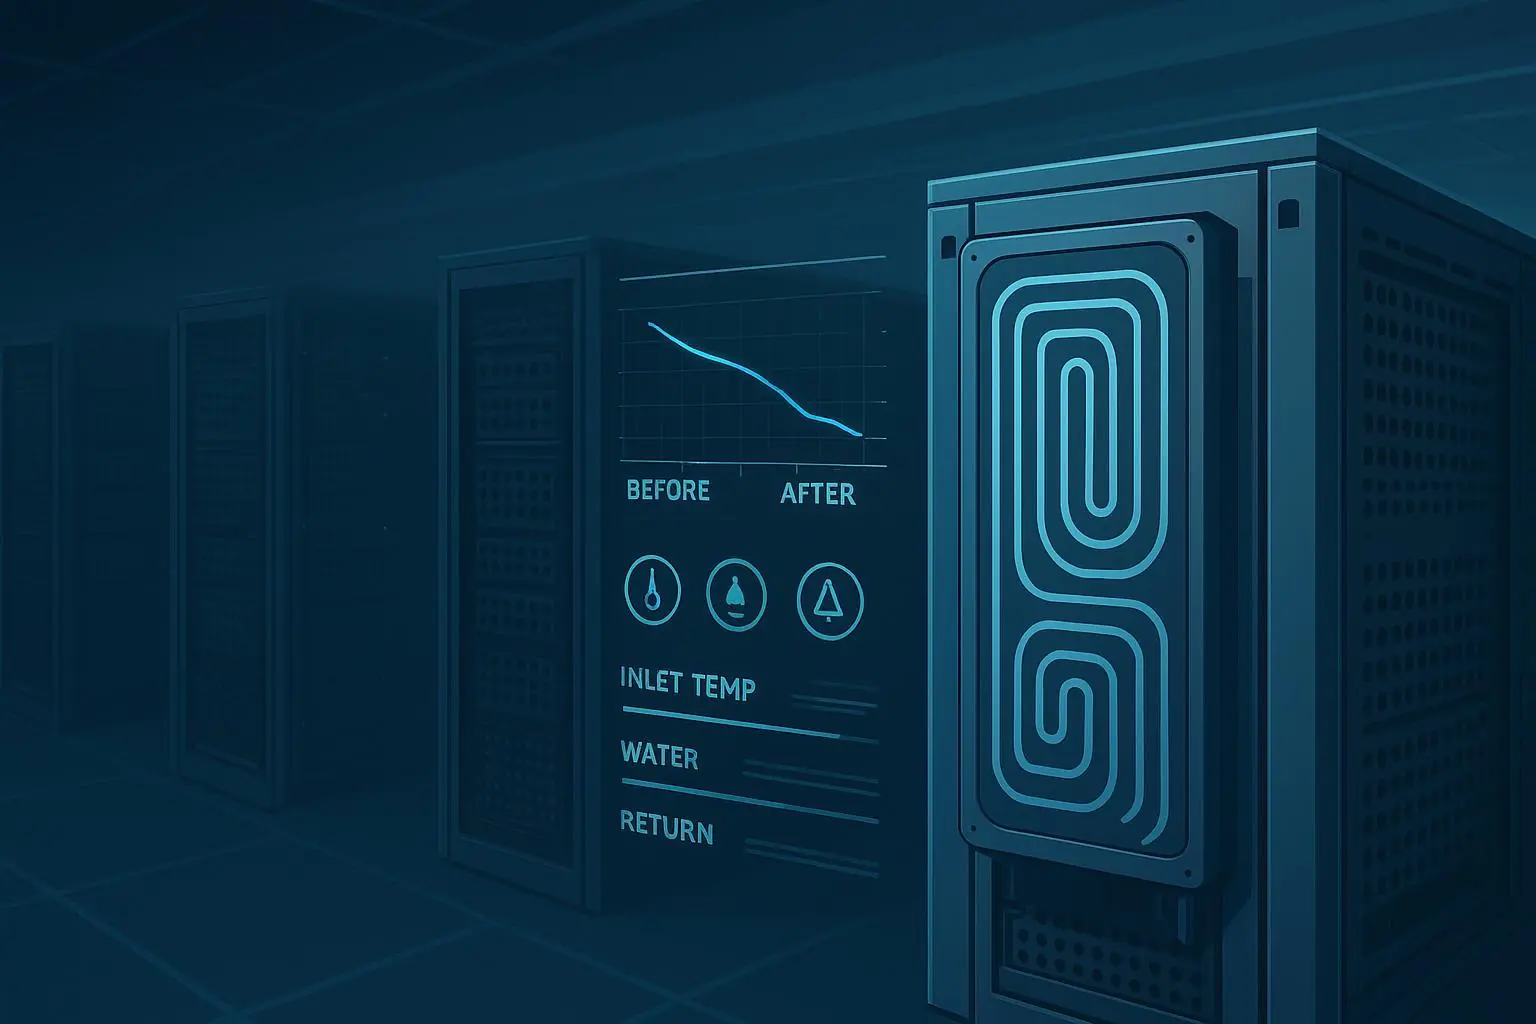
Step 7 — Create a rack heat map (and use it to drive sensor placement)
Heat maps help in two places:
pre-deployment: validating that your cooling delivery matches your rack layout
post-deployment: catching hotspots and drift before throttling
Copy/paste heat-map template (example layout)
Use this as a starting point. Put per-U heat contributions where you can, or at least per-node blocks.
Rack position | U range | Equipment block | Estimated power (kW) | Primary heat path | Notes |
|---|---|---|---|---|---|
Front-top | U38–U42 | GPU nodes |
| Air + (optional liquid) | hottest zone risk |
Front-mid | U20–U37 | GPU nodes |
| Air + (optional liquid) | check recirculation |
Front-bottom | U1–U19 | PSU/switch/other |
| Air | cable congestion |
Rear-top | U38–U42 | Exhaust region |
| Hot aisle / rear-door | check door clearance |
Rear-mid | U20–U37 | Exhaust region |
| Hot aisle / rear-door |
|
Rear-bottom | U1–U19 | Exhaust region |
| Hot aisle / rear-door |
|
Instrumentation plan (minimum viable)
At high density, guessing is expensive. Plan:
rack inlet temperature sensors (top/mid/bottom)
differential pressure where containment is used
water-side supply/return temperatures if hybrid or liquid
flow sensing and leak detection where applicable
PDU-level metering per rack
A monitoring layer matters because it turns “design assumptions” into numbers you can defend in acceptance and in future expansions.
Step 8 — Commissioning and verification checklist (edge-optimized)
Use this as your “done when” list.
Power
Single-line diagram matches installed as-built.
Breaker settings and coordination validated.
PDU telemetry validated per rack.
Failover tests executed and logged (utility loss, UPS transfer, generator start).
Cooling
Containment integrity check (smoke test or equivalent).
Cooling unit capacity verified at representative load.
Hotspot scan under load (infrared or equivalent) and compared to heat map.
Alarm thresholds set and tested.
Controls and monitoring
DCIM/BMS alarms route to the correct on-call path.
Trending enabled for inlet temps, power draw, and water-side deltas.
Common sizing mistakes (and how to avoid them)
Sizing only on average kW: GPU loads aren’t gentle. Track peaks and transients.
Assuming “capacity” means “delivery”: your plant can have kW on paper and still fail at the rack because of bypass and recirculation.
Ignoring low-load efficiency: modular redundancy is good, but validate losses when you run early-phase utilization.
Treating redundancy as a universal good: write down the failure cases you’re buying protection against.
Optional examples: applying this workflow with Coolnetpower components
These are examples of how a vendor might package power, cooling, and monitoring into a deployable edge footprint. The sizing method above stays the same.
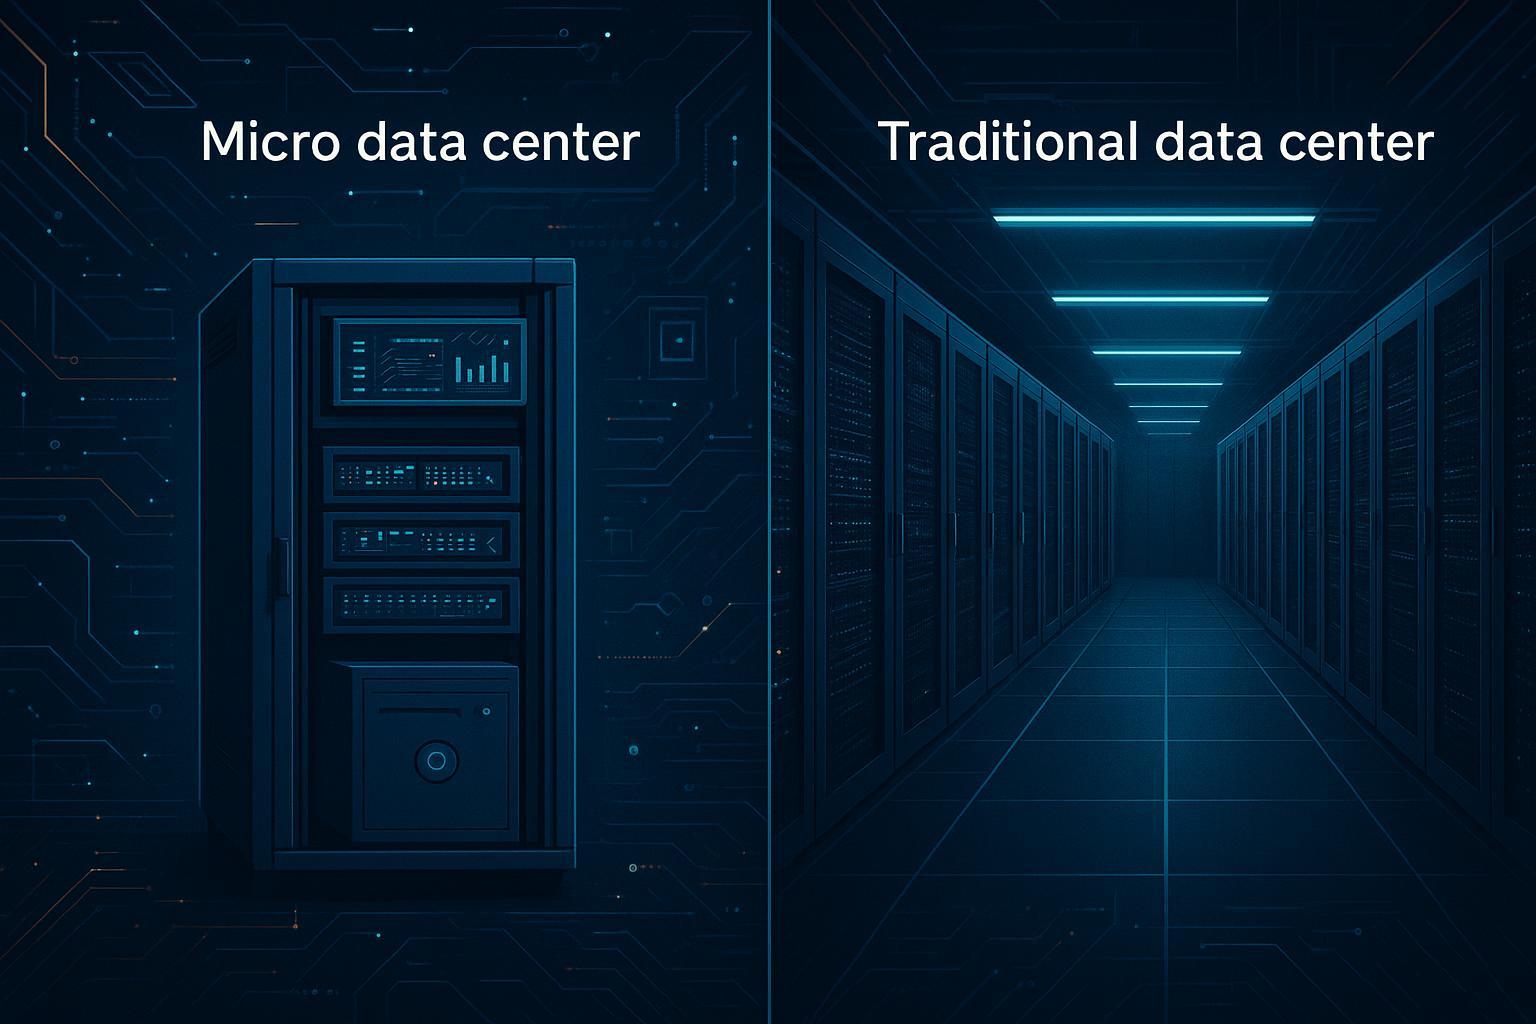
An integrated cabinet-style micro data center can simplify early edge deployments when you need a packaged power/cooling/monitoring baseline; see Coolnetpower MetaRack.
For modular row-level containment and integrated subsystems, see Coolnetpower MetaRow.
If you’re evaluating liquid options or hybrid pathways, start with a portfolio view like Coolnetpower liquid cooling solutions, then drill into a component example such as a Coolnetpower CDU.
For instrumentation and remote visibility patterns (power + environment + alarms), see Coolnetpower DCIM monitoring.
Next steps
If you want, I can turn your numbers into a one-page sizing pack (inputs, assumptions, outputs, and the redundancy scenario matrix).
CTA 1: Request an edge AI rack sizing worksheet + redundancy matrix.
CTA 2: Book a technical fit call to review your single-line and thermal assumptions.