Introduction
A five-year total cost of ownership (TCO) view is the only way to make cooling decisions that survive real-world volatility in 2025–2026. A one-time CapEx quote can look attractive while hiding the dominant cost drivers: electricity price swings, demand charges, water constraints, and maintenance labor.
Two changes make the “5-year lens” more important now than it was even a few years ago:
AI-driven rack density is breaking old baselines. Higher heat flux and denser rows increase airflow management risk, raise fan energy, and shorten the time you have to detect and correct hot spots.
Utility costs and constraints are less predictable. Energy price bands are wide across US markets, and demand charges (plus grid connection limits) can dominate the cooling business case.
This guide helps you model, compare, and act:
Build a defensible 5-year cooling TCO model (with explicit assumptions)
Convert PUE and WUE improvements into dollars you can defend in procurement
Compare air, high-efficiency air upgrades, and liquid paths using consistent criteria
Turn the model into an implementation roadmap that reduces risk
Where relevant, this article links to deeper internal references across Coolnetpower’s cooling TCO content library.
Build Your 5-Year TCO Model
Define scope and baseline IT load
Start by locking what’s in scope for the model. If you do this late, every stakeholder will argue with your numbers.
Recommended scope for a cooling TCO model (5-year):
Cooling system CapEx (equipment + install + commissioning)
Controls integration and measurement (submetering, sensors, trending)
Cooling energy (kWh) and demand charges (kW)
Water (if applicable), treatment, and compliance costs
Maintenance labor, spares, and service contracts
Then define your baseline IT load.
Baseline input options (pick one and document it):
IT average power (kW or MW) from 12 months of metered data (preferred)
IT annual energy (kWh/year) from IT meters (best if available)
Planned IT load growth (use a simple ramp curve by year)
If your facility is mixed-use or multi-tenant, document the metering boundary (what counts in “total facility energy” and what does not). This is a common reason PUE-based TCO models get rejected.
Convert ΔPUE into annual kWh and dollars
Once the IT baseline is set, you can convert a PUE improvement into savings.
Definitions (keep it simple and auditable):
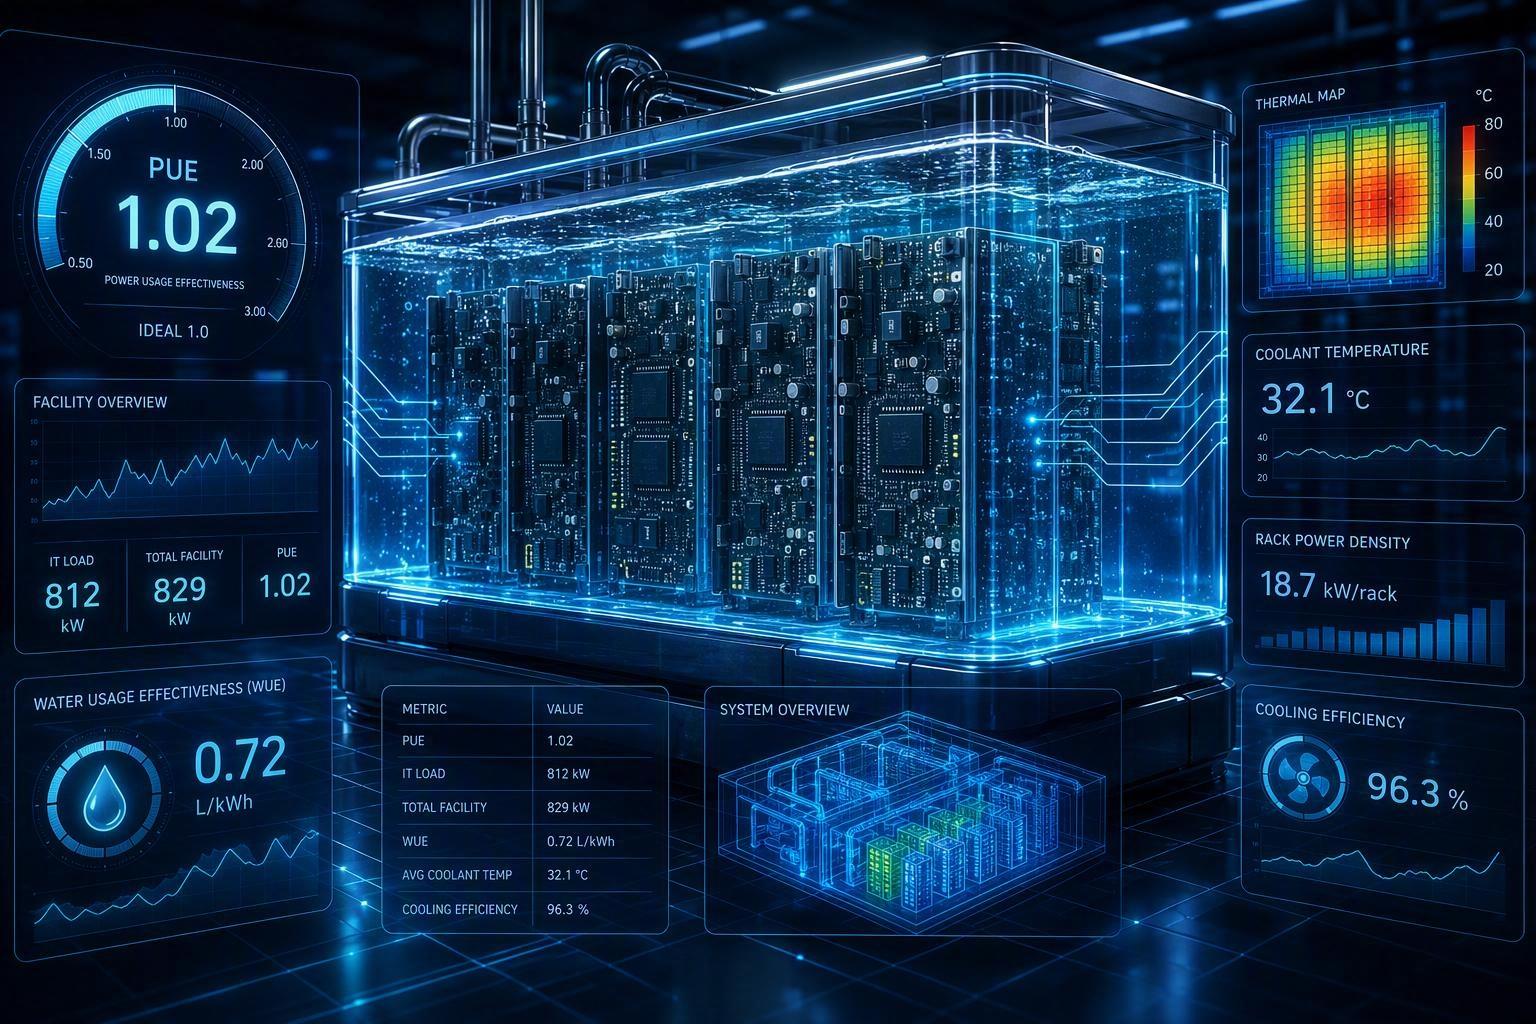
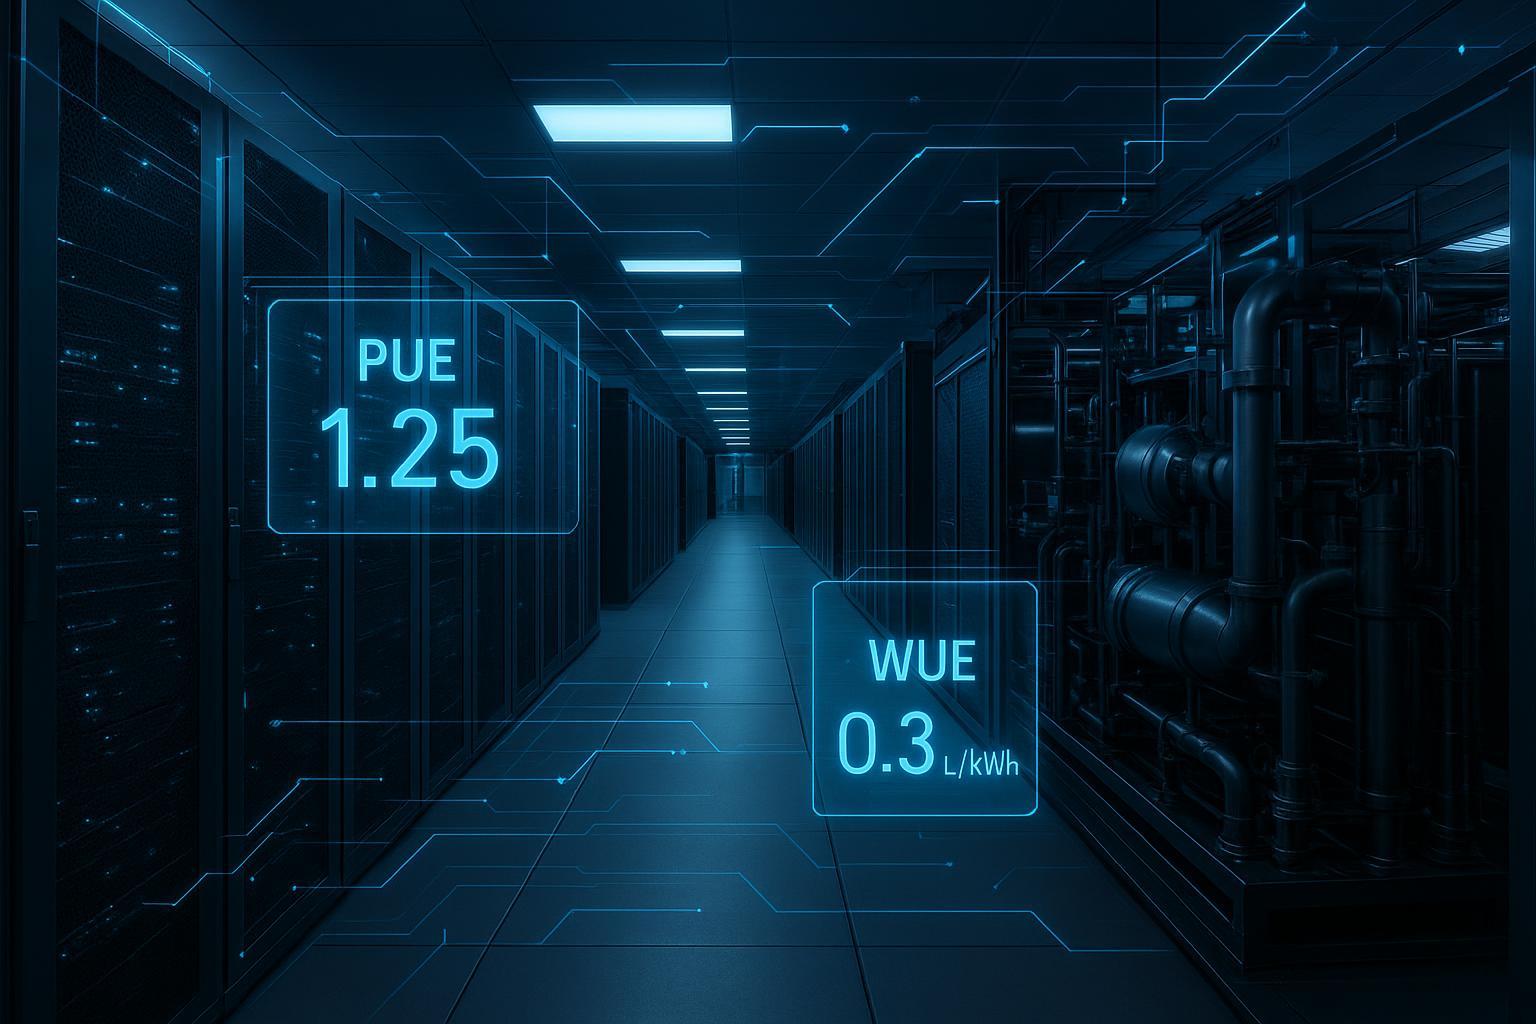
PUE = Total facility energy ÷ IT energy (measured over the same period)
A ΔPUE reduction means less overhead energy per unit of IT energy
Annual energy savings (kWh/year):
If you have IT energy:
ΔkWh ≈ E_IT × (PUE_before − PUE_after)
If you have IT power:
ΔkWh ≈ IT_kW × (PUE_before − PUE_after) × 8,760
Annual cost savings ($/year):
Δ$ ≈ ΔkWh × electricity_rate ($/kWh)
For a worked example of the same math (and what to include in the one-time vs recurring buckets), see 5-year precision cooling PUE cost model.
Add WUE, water costs, and maintenance
Energy is usually the largest TCO line, but it’s not the only one that surprises budgets.
Water: model it explicitly (even if you think it is “small”).
WUE = annual site water use (L) ÷ annual IT energy (kWh)
Annual water use (L/year) can be estimated as:
Water_L ≈ WUE × E_IT
Then convert to cost:
Water_cost ≈ Water_volume × local_water_rate
For definitions and reporting boundaries, The Green Grid’s WUE framework and ISO/IEC 30134-9 are widely referenced; Vertiv’s overview of Water Usage Effectiveness (WUE) for data centers is a convenient starting point.
In many US markets, the risk matters as much as the current rate: drought restrictions, permitting delays, reclaimed-water requirements, and community scrutiny can create schedule and operating constraints.
Maintenance: treat it as a delta, not a vague percentage.
Split O&M into:
Avoided air-side work: hot-spot firefighting, filter churn, fan failures, rebalancing
Added complexity: liquid loop checks, sensor calibration, leak-response drills, fluid sampling
If you need a procurement-friendly structure for retrofit ROI and payback math, Coolnetpower’s data center cooling retrofit ROI and TCO provides a step-by-step template.
The goal is not to prove “maintenance goes down.” It’s to create a realistic 5-year view that your operations team will accept.
Scenario Comparison: Air vs High‑Efficiency Options
Baseline air with containment/economizers
If you are operating air-cooled rooms today, your lowest-risk savings often come from airflow discipline and reducing unnecessary mechanical work.
What typically moves the needle without changing your cooling topology:
Hot/cold aisle containment (and sealing bypass/leakage paths)
Economizers (air-side or water-side, where climate and filtration allow)
Higher supply air temperatures within recommended envelopes
Fan power reduction via better pressure management
If you’re planning economizer improvements, Coolnetpower’s internal walkthrough on how economizers lower PUE with free cooling is a useful companion for turning “hours in mode” into expected PUE movement.
TCO framing:
CapEx is usually moderate and localized
Savings are driven by lower fan energy, fewer hot-spot excursions, and more hours in “free cooling” modes
Risk is mainly execution quality: containment gaps, controls tuning, and change control
If your racks are trending upward in density, treat this as your foundation layer—even if you plan to adopt liquid cooling later.
Liquid cooling paths: D2C and immersion
When sustained rack densities push beyond what airflow can reliably support, liquid paths become less about “efficiency marketing” and more about risk control and capacity unlock.
Direct-to-chip (D2C) liquid cooling
Removes a large portion of heat at the source
Can enable higher coolant temperatures (more economizer hours, less compressor work)
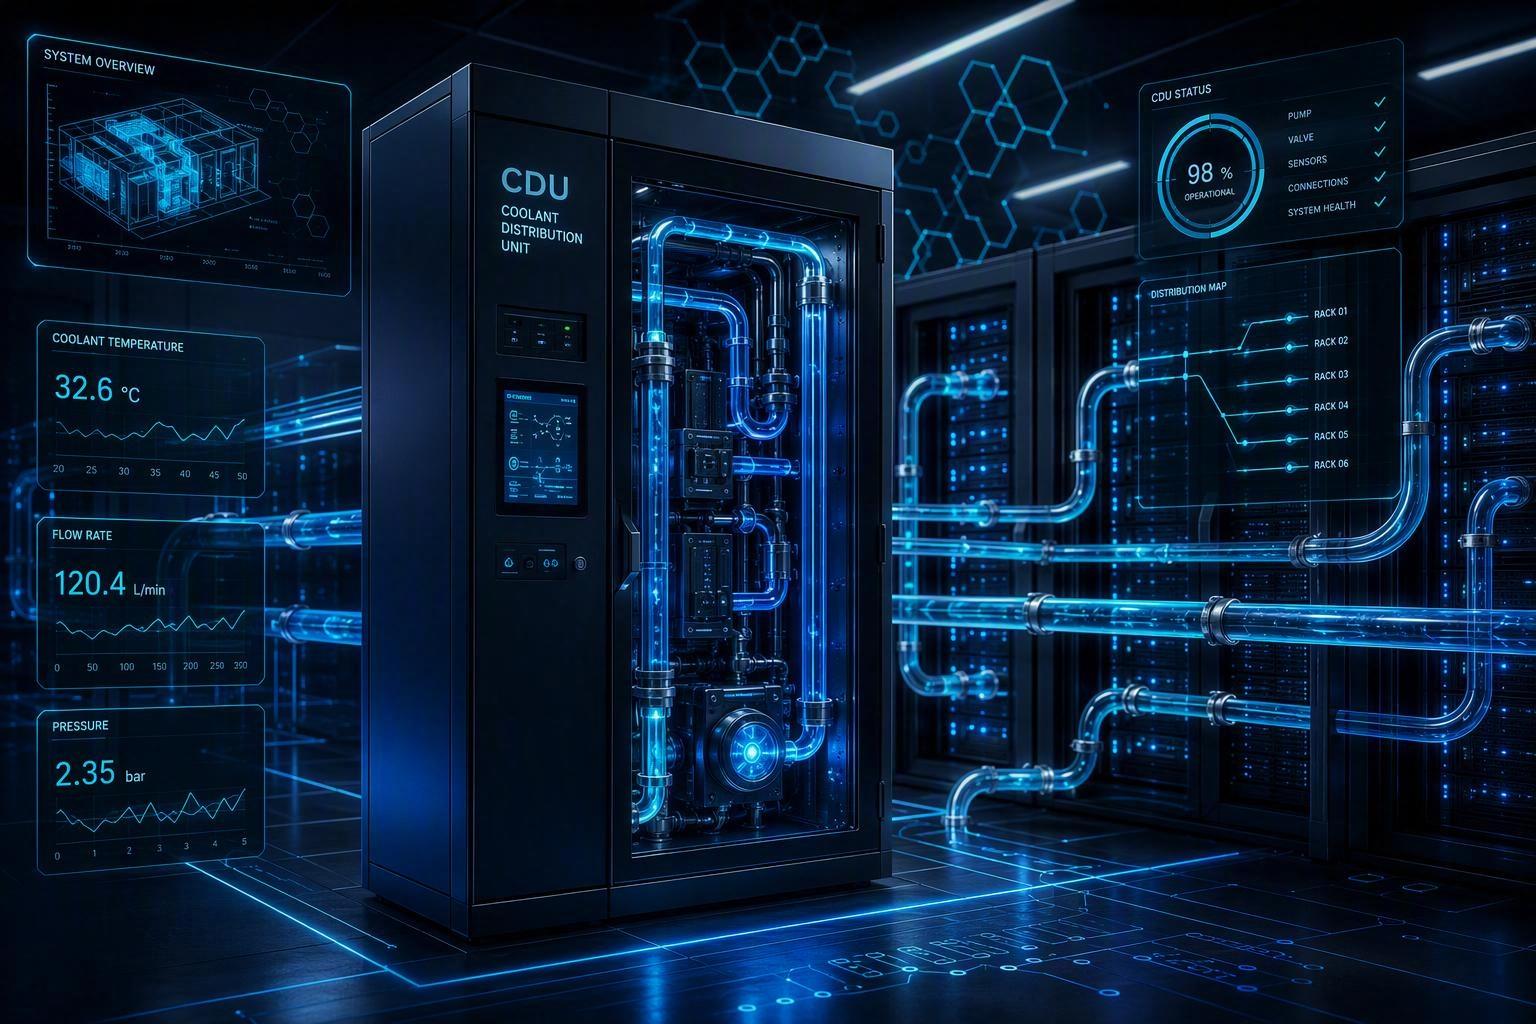
Requires plumbing, manifolds, CDU capacity planning, and operational readiness
Immersion cooling
Submerges servers in dielectric fluid for very high heat removal
Can simplify air management but introduces supply-chain, serviceability, and fluid management considerations
TCO framing:
CapEx is higher, but at high density the avoided costs can be meaningful: fewer air-side upgrades, reduced throttling risk, and potential facility overhead reduction
O&M shifts from “airflow firefighting” to “loop management and procedures”
Hybrid designs by density and climate
Most operators don’t flip a site from air to liquid overnight. The practical path is often hybrid:
Keep general rooms air-cooled (with strong containment and controls)
Deploy liquid (D2C, rear-door HX, or immersion) for high-density pods
Use climate-appropriate heat rejection (dry coolers where water risk is high)
For precision cooling TCO modeling, Coolnetpower supports procurement-ready baselines, scope control, and phased retrofit assumptions—so the model stays auditable across engineering, finance, and compliance.
Cost Drivers, Risks, and Sensitivities
Energy price bands and demand charges
A 5-year model should not use one electricity rate. Use bands and show sensitivity:
$0.08/kWh (low) → $0.25/kWh (high) is realistic across US markets and contract structures
Add a demand-charge line if applicable:
Cooling upgrades that reduce peak kW (not just kWh) can materially change the business case
If you cannot credibly forecast peak reduction, treat demand savings as a separate sensitivity scenario
Practical approach: model three cases—conservative, base, aggressive—using different ΔPUE outcomes and electricity rates.
Water use, compliance, and drought exposure
Water is no longer a “facilities-only” topic.
In the US, water constraints show up as:
Drought restrictions and curtailment risk
Permitting friction and community scrutiny
Requirements to use reclaimed or non-potable water
Use WUE to make water impact legible, but also document:
Whether the design relies on evaporative heat rejection
What happens under drought restrictions
Whether the site has a reclaimed-water option
Maintenance, reliability, and staffing impacts
Cooling TCO is often underestimated because it ignores operational friction.
Key questions for your 5-year model:
Does the design reduce incident frequency (hot spots, alarms, rebalancing)?
Does it increase procedural complexity (training, leak response, spares)?
What is your staffing model: on-site, remote, or mixed?
Reliability and staffing aren’t “soft factors.” They become cost when:
SLA risk leads to conservative over-provisioning
Troubleshooting time grows with system complexity
Preventive maintenance windows expand
Standards, Incentives, and Policy Signals
ASHRAE TC 9.9 thermal envelopes
ASHRAE’s guidance (including TC 9.9) is often the reference point for acceptable operating ranges in procurement and risk reviews.
For your TCO model, the key is not to quote a single temperature number—it’s to show:
What inlet conditions you are designing for
How excursions are detected and controlled
How that affects fan energy, economizer hours, and reliability risk
If you want a practical, implementation-level checklist for 2025–2026 envelope decisions, see ASHRAE TC 9.9 temperature and humidity best practices (2026).
Utility and federal incentives (2024–2026)
Incentives change by utility territory, but several themes matter in 2024–2026:
Utility programs often fund economizers, controls upgrades, and efficiency retrofits when you can show measurement & verification (M&V)
Federal and DOE programs are funding higher-performance cooling R&D and pilots; requirements typically emphasize clear baselines and verifiable savings
If you plan to pursue incentives, bake the M&V cost into CapEx (submetering, trending, commissioning). Incentive dollars are rarely “free.”
Heat reuse (ERE) and local ordinances
Heat reuse can materially change the economics when your site has an adjacent heat sink (district energy, building loads, process heat).
Warm-water liquid loops can improve feasibility
Ordinances and reporting requirements can influence timelines and design choices
Even if you don’t monetize heat reuse today, it can be a strategic hedge as carbon and efficiency reporting tightens.
Implementation Roadmap
Quick wins in existing air‑cooled rooms
Start with measures that reduce risk and capture savings quickly:
Seal bypass air and enforce airflow discipline (blanking panels, floor grommets, cable cutouts)
Validate containment integrity (smoke/pressure checks)
Tune setpoints and control loops based on measured return temperatures, not assumptions
Add or improve submetering so you can prove ΔPUE, not just claim it
Planning a liquid or hybrid rollout
A low-risk rollout looks like a staged program:
Select density bands (which rows/pods need liquid, now and in 18–36 months)
Define the cooling boundary (what stays air, what shifts to liquid)
Design for maintainability (CDU redundancy, isolation valves, procedures)
Train operations early (leak response, alarms, spares)
Avoid “all-or-nothing” decisions. Hybrid is often the fastest way to align engineering, finance, and compliance.
Budgeting, financing, and measurement
Make budgeting defensible by separating:
Non-negotiable risk controls (monitoring, leak detection, redundancy)
Efficiency-driven upgrades (economizers, VSD fans, controls)
Growth-driven capacity unlocks (liquid pods, CDU capacity, distribution)
On measurement, define upfront:
Baseline period (12 months preferred)
Metering points and boundaries
How you will report PUE and WUE (and how often)
This prevents post-project disputes and makes future optimization easier.
Conclusion
Five-year cooling TCO is not a finance exercise—it’s a risk-management tool that lets you make cooling decisions that hold up under higher rack density and volatile utilities.
Key takeaways to lower 5-year cooling TCO now:
Convert ΔPUE into dollars using a clear IT baseline and a defined metering boundary
Model energy price bands and treat demand charges as a separate sensitivity where needed
Add WUE and water risk as explicit line items (cost + compliance exposure)
Compare options with consistent assumptions and an execution-ready roadmap
Prioritized next steps and decision checks:
Confirm IT baseline (kW/kWh) and metering boundary
Build three scenarios (conservative/base/aggressive) with explicit ΔPUE and WUE assumptions
Identify which rows are future “liquid candidates” based on density and downtime tolerance
Define M&V so savings are provable
Where to revisit assumptions as rates and loads change:
Electricity contracts and peak demand structure
Rack density growth curve (especially AI expansions)
Water pricing and drought restrictions
Maintenance labor availability and service contract costs