Table of Contents
ToggleIntroduction
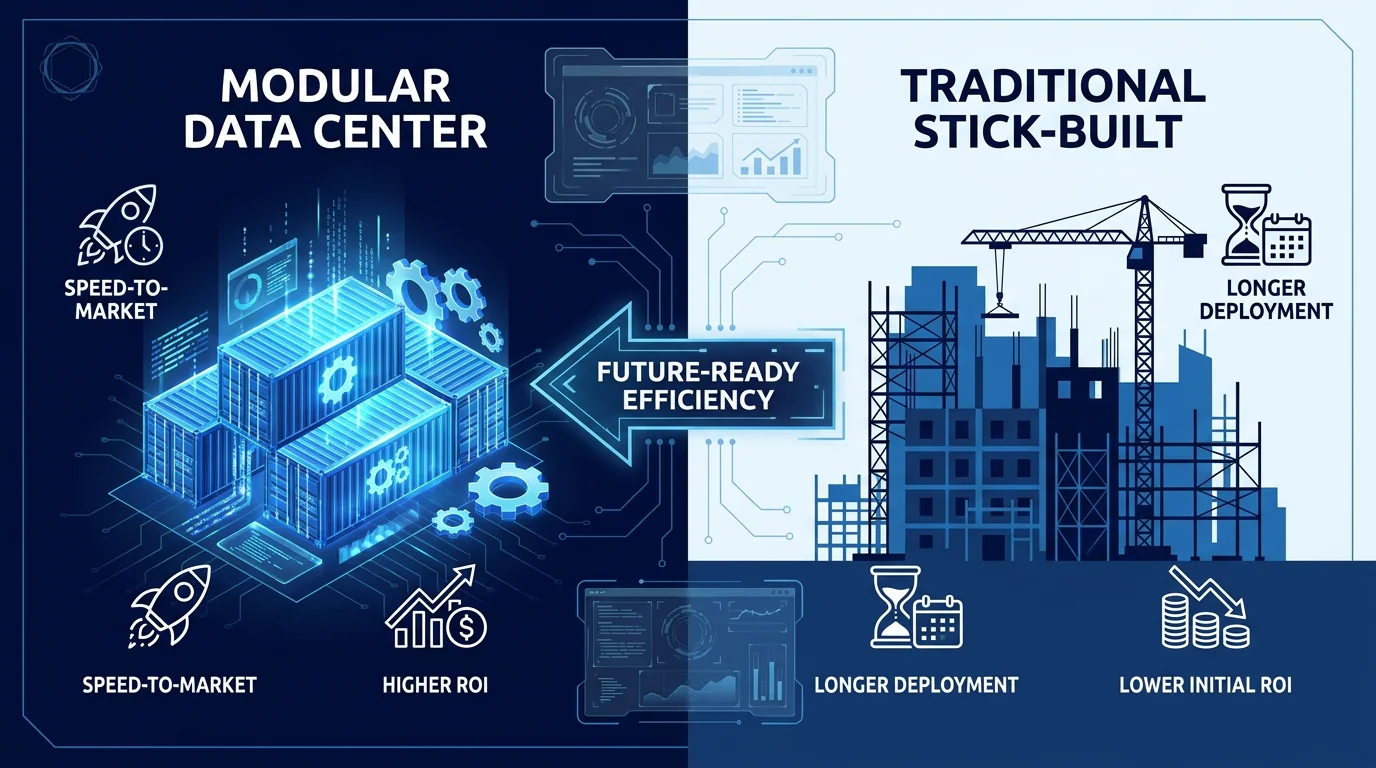
Evaluating a data center capital deployment is no longer a simple calculation of square footage and cost per megawatt. In today’s U.S. market, volatile power prices, supply chain bottlenecks, and the rapid rise of high-density computing loads have reshaped infrastructure economics. Enterprise decision-makers, colocation providers, and project directors face a fundamental architectural choice: build a traditional stick-built facility from the ground up or deploy a prefabricated modular data center.
Why ROI comparisons matter now in the U.S. market
The financial stakes of data center site selection and construction have escalated sharply across North America. Utility interconnection delays, rising electrical equipment lead times, and fluctuating regional power tariffs mean that time-to-market directly dictates project profitability. A facility completed six months late does not merely incur overhead costs; it forfeits millions of dollars in unrealized IT hosting revenue. Consequently, static construction budgets are giving way to dynamic Total Cost of Ownership (TCO) models that quantify risk, operational efficiency, and revenue velocity.
What this analysis covers: timelines, CAPEX, OPEX, risk, and scalability
This comparative analysis evaluates modular and traditional data center builds across five core economic dimensions:
Build Timelines: Comparing multi-year on-site civil schedules with parallel off-site factory integration.
CAPEX Structure: Evaluating upfront capital commitments versus phased, module-by-module investments.
Energy OPEX & PUE: Analyzing how cooling architecture and partial-load efficiency impact long-term electricity bills.
Risk Profile: Mitigating weather delays, change orders, and on-site labor inflation.
Scalability: Matching capital outlay with real-time compute demand.
How to use this guide for 5–10 year investment decisions
This guide provides a structured framework for project directors, chief technology officers, and financial officers evaluating 1 MW to 10 MW+ deployments over a 5 to 10-year investment horizon. By examining real-world deployment data, baseline cost inputs, and financial sensitivity variables, infrastructure leaders can build a defensible Net Present Value (NPV) and Internal Rate of Return (IRR) model tailored to their operational footprint.
ROI drivers at a glance
Understanding modular data center ROI requires moving beyond initial equipment price tags to evaluate how delivery speed, capital timing, and efficiency interact across the asset lifecycle.
Key Takeaway: The primary driver of modular data center ROI is time-to-market velocity and capital draw deferral. Bringing capacity online 12 to 18 months faster shifts cash flows forward, significantly boosting NPV and shortening capital payback periods.
Time-to-market advantage
The speed at which a data center generates its first dollar of revenue or supports internal compute workloads is the single largest contributor to financial outperformance. Traditional stick-built projects follow a sequential development path where civil works, structural framing, electrical runs, and mechanical assembly occur entirely on-site. Modular construction uncouples these dependencies by manufacturing prefabricated power, cooling, and whitespace enclosures in parallel with site grading and foundation work. This parallel execution path reduces overall project schedules by 30% to 50%.
Phased CAPEX and capital efficiency
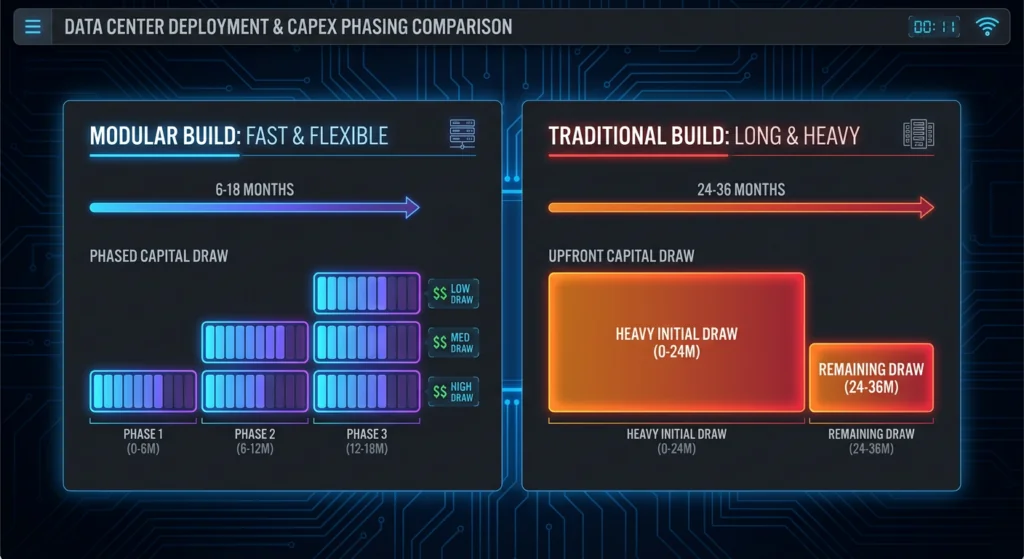
Traditional construction forces operators to commit 100% of the building’s capital expenditure on day one, building out massive empty whitespace and power capacity years before it is fully populated. Prefabricated modular architectures enable a “pay-as-you-grow” financial model. Infrastructure managers can deploy a baseline 1 MW module today and add incremental 1 MW or 2 MW modules as tenant demand materializes. Deferring capital expenditure lowers the weighted average cost of capital (WACC) and preserves liquidity.
Energy efficiency and OPEX
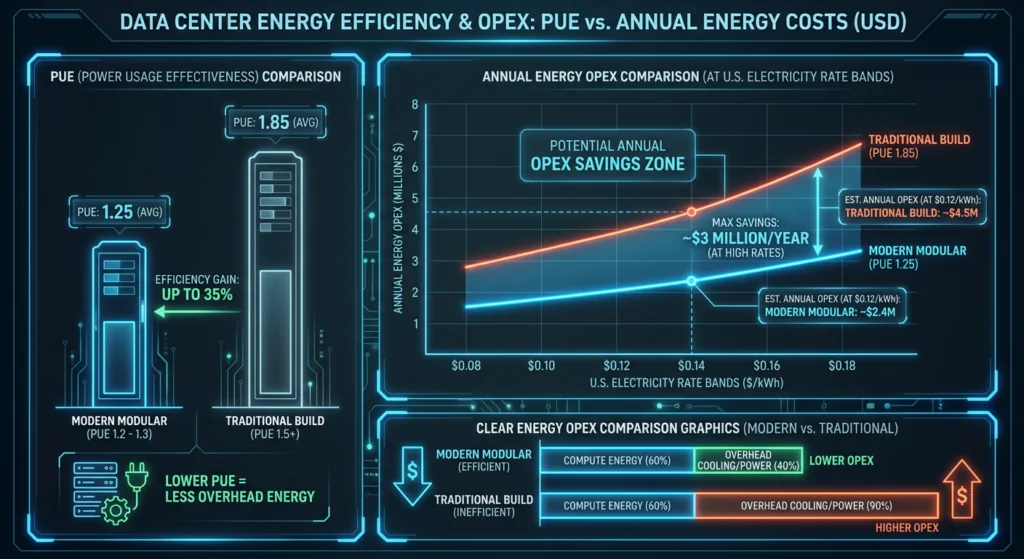
Over a 10-year facility lifespan, electricity expenditure frequently exceeds initial construction CAPEX. Modular data centers benefit from factory-controlled quality standards, tightly coupled airflow management, and integrated cooling loops that achieve lower Power Usage Effectiveness (PUE) ratings. Compared to legacy stick-built designs running at PUEs of 1.55 or higher, modern modular systems operate comfortably between 1.20 and 1.30, generating sub-second operational savings that compound year after year.
CAPEX and deployment speed
Build timelines (months)
The difference in delivery schedules between modular and traditional builds represents a structural paradigm shift in engineering execution:
Construction Phase | Traditional Stick-Built | Modular / Prefabricated | Key Schedule Differentiator |
|---|---|---|---|
Design & Permitting | 4–6 Months | 2–4 Months | Standardized vendor reference designs accelerate permitting |
Site Prep & Foundation | 6–8 Months | 3–5 Months (Parallel) | Concurrent factory fabrication while site is graded |
Enclosure & MEP Assembly | 10–16 Months | 2–4 Months (Off-site) | Factory pre-assembly eliminates weather and site trade delays |
Commissioning & Go-Live | 4–6 Months | 1–2 Months | Factory Acceptance Testing (FAT) pre-validates performance |
Total Timeline | 24–36 Months | 6–18 Months | Up to 18–24 months earlier operational revenue |
According to GBC Engineers’ study on modular vs traditional build schedules, traditional construction schedules routinely span 24 to 36 months, whereas standardized modular units deliver fully operational capacity within 6 to 18 months.
CAPEX ranges and parity/savings
On a pure equipment-for-equipment basis at full buildout capacity, baseline equipment costs between modular units and custom traditional materials approach parity. However, fully burdened CAPEX tells a different story:
On-Site Labor Reduction: Specialized MEP (mechanical, electrical, plumbing) labor in major U.S. markets is expensive and scarce. Modular assembly shifts up to 80% of labor hours to a controlled factory setting, cutting labor overhead by 20% to 35%.
Avoided Change Orders: Unforeseen field conditions on traditional job sites typically drive 5% to 15% budget overruns. Factory prefabrication locks in pricing, significantly limiting cost variance.
Site Infrastructure Overhead: Modular units require smaller building footprints and simplified civil structures, lowering initial civil engineering expenditures.
Industry research cited in Inflect’s 2026 TCO analysis of modular vs traditional data centers demonstrates that modular execution yields overall initial CAPEX savings ranging from 10% to nearly 30% depending on site complexity and geographic labor rates.
Financing, draw schedules, and certainty
Financing a multi-million dollar infrastructure project introduces interest expense and debt service burdens during construction. In a traditional build, capital draws occur continuously across 30+ months before a single rack powers on.
With modular builds, capital draws are tightly aligned with module delivery milestones. Investors avoid committing millions in idle capital for years. Furthermore, predictable factory timelines mitigate supply chain risk, giving lenders and corporate boards higher confidence in completion dates and interest-during-construction (IDC) calculations.
Energy OPEX and PUE impacts
PUE benchmarks (legacy vs modern vs modular)
Power Usage Effectiveness (PUE) measures total facility power divided by IT equipment power. A PUE of 1.0 represents perfect efficiency where 100% of incoming electricity reaches the servers.
Legacy Stick-Built (PUE 1.55 – 1.80): Older legacy facilities or custom stick-built sites with long duct runs, oversized chillers, and uncontained hot/cold aisles suffer from significant thermodynamic loss.
Modern Standard Stick-Built (PUE 1.35 – 1.45): Contemporary custom builds with economizers achieve respectable efficiency, but performance degrades when operating at partial load during early deployment stages.
Standardized Modular (PUE 1.20 – 1.30): Factory-engineered modular units feature tightly integrated close-coupled cooling (such as in-row DX, chilled water, or liquid cooling cold plates) with engineered containment. Because modules operate near their optimal design capacity from day one, partial-load efficiency losses are minimized.
U.S. electricity price bands
Industrial electricity rates across the United States vary dramatically by region, making cooling efficiency a decisive factor in long-term site viability:
Low-Cost Regions ($0.06 – $0.09 / kWh): Pacific Northwest (hydro), select Texas/PJM nodes.
U.S. Industrial Average ($0.10 – $0.13 / kWh): Midwest, Southeast, and mid-Atlantic technology corridors.
High-Cost Regions ($0.14 – $0.20+ / kWh): California, New England, and urban edge markets.
OPEX math at 1–10 MW
To illustrate the financial impact of PUE differences, consider a 5 MW IT load facility operating continuously (8,760 hours per year) at an average U.S. electricity tariff of $0.12 per kWh:
$$text{Facility Power (kW)} = frac{text{IT Load (kW)}}{frac{1}{text{PUE}}} = text{IT Load} times text{PUE}$$
Traditional Build (PUE 1.55):
Facility Power Draw = $5,000 text{ kW} times 1.55 = 7,750 text{ kW}$
Annual Electricity Consumption = $7,750 text{ kW} times 8,760 text{ hrs} = 67,890,000 text{ kWh}$
Annual Energy Cost = $67,890,000 text{ kWh} times $0.12 = mathbf{$8,146,800 / text{year}}$
Modular Build (PUE 1.25):
Facility Power Draw = $5,000 text{ kW} times 1.25 = 6,250 text{ kW}$
Annual Electricity Consumption = $6,250 text{ kW} times 8,760 text{ hrs} = 54,750,000 text{ kWh}$
Annual Energy Cost = $54,750,000 text{ kWh} times $0.12 = mathbf{$6,570,000 / text{year}}$
Annual OPEX Delta:
Annual Electricity Savings = $$8,146,800 – $6,570,000 = mathbf{$1,576,800 / text{year}}$
7-Year Cumulative OPEX Reduction: Over $mathbf{$11.03 text{ Million}}$ in direct energy savings.
5–10 year ROI model framework
To evaluate an infrastructure investment accurately, financial managers must construct a discounted cash flow (DCF) model comparing modular and traditional deployment tracks.
Assumptions and inputs
A robust financial comparison uses standardized baseline parameters:
IT Capacity: 5 MW IT load baseline.
Initial CAPEX: $7.5M per MW for traditional ($37.5M total) vs. $6.8M per MW for modular ($34.0M total baseline).
Time-to-Market: 24 months for traditional vs. 9 months for modular (15-month revenue lead time).
Monthly Revenue per MW: $120,000 per MW in colocation/hosting capacity value ($600,000/month for 5 MW).
Discount Rate (WACC): 8.5%.
Electricity Rate: $0.12 / kWh.
Sensitivity analysis that matters
When testing financial assumptions, three variables exert the largest influence on outcomes:
Utility Delay Sensitivity: In traditional builds, local grid or municipal permitting delays of 6 to 12 months destroy project NPV rapidly due to ongoing idle carrying costs.
Power Price Volatility: A $0.03/kWh surge in electricity tariffs increases annual operating costs by over $1.3 Million on a 5 MW facility, making PUE 1.20 performance an essential risk hedge.
Capacity Utilization Ramp: If tenant onboarding is gradual (e.g., 1 MW per year), modular phased draws preserve capital and yield higher IRR than building a full 5 MW traditional shell upfront.
Reading payback, NPV, and IRR
When running these inputs through a 7-year DCF model:
Simple Payback Period: Traditional builds typically achieve simple payback in 5.2 to 6.5 years post-completion. Modular builds achieve payback in 2.8 to 3.8 years, driven by 15 months of accelerated cash inflows and lower initial outlay.
Net Present Value (NPV): Due to discounted early revenues ($9.0M captured during the 15-month timeline gap) and continuous OPEX savings, modular builds deliver a 25% to 40% higher 7-year NPV.
Internal Rate of Return (IRR): Modular projects consistently show a 600 to 1,200 basis point higher IRR compared to traditional stick-built facilities under equivalent market pricing.
Decision scenarios and pitfalls
While financial metrics strongly favor modular construction for many enterprise applications, selecting the right deployment model depends on specific operational contexts.
Where modular wins
Modular data center builds represent the clear strategic and financial choice in:
Rapid Expansion Markets: Regions where compute demand outpaces local construction labor capacity.
High-Density AI & Edge Deployments: Workloads requiring 20 kW to 80 kW+ per rack where close-coupled cooling and liquid cooling integration are required.
Phased Commercial Colocation: Facilities where revenue must match capital outlay to preserve debt covenants.
Power or Space Constrained Sites: Urban edge or industrial retrofits with strict footprint restrictions.
Where traditional wins
Traditional stick-built construction remains competitive when:
Ultra-Large Hyperscale Campuses: Single-tenant campuses exceeding 50 MW to 100 MW+ where custom civil structures achieve massive economies of scale.
Strict Architectural Mandates: Facilities requiring complex masonry, historical facade integration, or multi-story specialized corporate headquarters buildings.
Long-Term Static Footprints: Projects with fixed, non-expanding compute requirements and fully subsidized local power tariffs.
Common modeling pitfalls
When constructing ROI models, avoid these frequent analytical errors:
Ignoring the Time-Value of Revenue: Modeling CAPEX and OPEX while omitting the cash flow impact of 12 to 18 months of early operational uptime.
Assuming Constant PUE Across Load Curves: Traditional facilities running at 25% load during initial fill-out often suffer PUE spikes above 1.80. Modular units remain near design efficiency by activating modules as load demands.
Underestimating On-Site Contingency Costs: Failing to factor in site labor inflation, severe weather delays, and subcontractor change orders typical of stick-built job sites.
Infrastructure planners evaluating modular architectures can partner with specialized data center equipment manufacturers like Coolnetpower, leveraging their deep engineering expertise in prefabricated modular enclosures, micro data centers, and advanced liquid cooling technologies to optimize both initial CAPEX and long-term PUE metrics.
Conclusion
Key takeaways on time, CAPEX phasing, and energy OPEX
Time Velocity: Modular construction compresses delivery timelines from 24–36 months down to 6–18 months, unlocking up to 18 months of accelerated revenue generation.
Capital Efficiency: Factory prefabrication reduces initial CAPEX by 10% to 30% through labor optimization and enables phased capital deployment that matches compute demand.
Operational Savings: Tightly engineered modular airflow and integrated cooling deliver PUEs of 1.20 to 1.30, reducing annual energy OPEX by over $1.5 Million on a 5 MW load at average U.S. electricity rates.
When each approach leads on ROI and why
For the vast majority of enterprise, edge, and mid-scale colocation deployments (1 MW to 20 MW), modular data centers deliver superior ROI, higher IRR, and significantly lower risk. Traditional stick-built construction maintains a niche in mega-hyperscale campuses where long-term static capacity justifies multi-year civil engineering timelines. By aligning capital commitment with operational reality, modular data centers provide a resilient, future-proof platform for modern digital infrastructure.