Introduction
Cooling load calculation is how you turn “we think we’ll run around X kW” into a defensible answer to two questions every project eventually faces:
How much heat must the mechanical system remove at peak?
How will we prove, during commissioning and operations, that the space is actually being cooled within safe limits?
This guide is for data center and telecom facility teams, EPC partners, and project leads who need a transparent method to estimate cooling capacity early—before detailed CFD and vendor selections—without hiding behind black-box assumptions.
Scope, assumptions, and alignment with ASHRAE TC 9.9 and 90.4
Scope: Estimating the heat load that must be removed from the white space (and closely coupled support rooms, if applicable) so you can size cooling capacity, set redundancy targets, and plan validation.
Core assumption: In the IT space, electrical power consumed becomes heat that must be removed.
Standards alignment:
ASHRAE TC 9.9 focuses on thermal guidelines and measurement at IT equipment inlets (what the servers actually see), which is essential for validating your calculation.
ASHRAE 90.4 is an energy standard for data centers that influences how designers think about mechanical/electrical efficiency and climate-zone impacts.
(Standards are not a substitute for engineering judgment, but they’re a good way to keep assumptions and validation methods consistent across stakeholders.)
Units used and data sources priority
You’ll see cooling load expressed in:
kW (electrical power / heat rate)
BTU/h (common HVAC heat-rate unit)
tons of refrigeration (TR) (12,000 BTU/h per ton)
Data priority:
Metered values (UPS/PDU output, branch circuit monitoring, rack PDUs)
Design power budgets (per rack and per row, with documented concurrency)
Nameplate (last resort, usually worst-case)
Key Takeaway: The fastest way to oversize (or under-size) cooling is to treat nameplate as “expected” instead of “possible.” Metered peaks + documented headroom are usually more defensible.
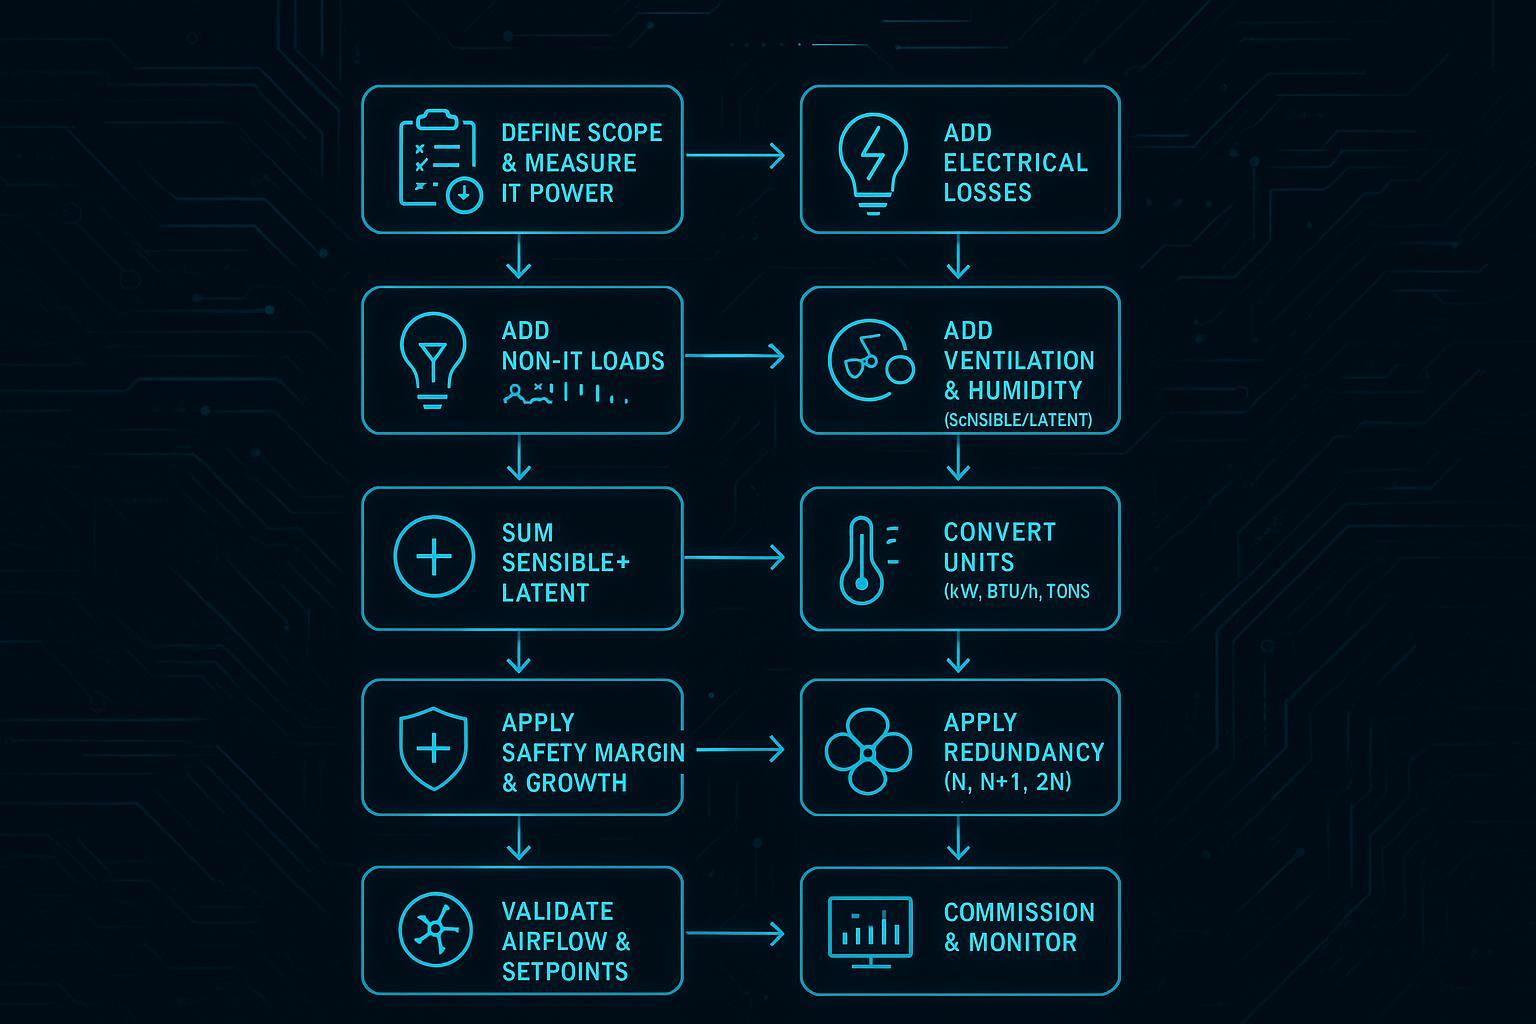
Step overview
Define, measure, and baseline
Your goal in this step is not a perfect number—it’s a number you can defend.
Define the boundary: what’s inside the cooled volume (white space only, or white space + UPS room, batteries, network rooms, etc.).
Choose the IT load basis: metered peak, modeled peak, or conservative estimate.
Establish a baseline period (days to weeks) if you have an operational site.
Done when:
You can point to a single IT kW figure and explain where it came from.
Add non‑IT loads and latent components
Most data centers are predominantly sensible load, but you still need to account for:
Electrical losses (UPS, transformers, PDUs)
Lighting and people
Envelope gains (when applicable)
Ventilation and humidity control (where latent can appear)
Done when:
You have a complete list of heat contributors inside your boundary.
Apply margins, redundancy, and plan validation
Sizing is not just adding 10–20%. You also need to decide:
Growth headroom vs. “day-1” install
Redundancy intent (N, N+1, 2N)
How you’ll validate the model with sensors and commissioning tests
Done when:
Your final number includes explicit margin logic and a validation checklist.
Component calculations (data center cooling load calculation)
IT load and electrical losses
1) Start with IT power (kW)
Use the best available number for IT equipment power inside the cooled space.
If you have metering: use a representative peak (for example, a worst-case 5-minute or 15-minute average during high utilization) rather than a single instantaneous reading.
If you don’t have metering: build from rack power budgets and realistic concurrency (how many racks will actually operate at the budget simultaneously).
2) Convert IT kW to heat rate
A useful baseline conversion:
1 kW ≈ 3,412 BTU/h
Tons (TR) = BTU/h ÷ 12,000
This is just unit conversion—no “efficiency” assumption yet.
3) Add electrical losses inside your boundary
If the UPS, PDUs, transformers, or distribution gear are in the conditioned space, their losses become additional heat load.
A practical first-pass approach:
Treat UPS + distribution losses as a loss factor applied to IT kW (document your assumption).
If you have equipment efficiency curves and expected part-load, use them—losses are not constant.
A transparent way to express it:
Total electrical heat (kW) = IT kW × (1 + loss factor)
Example loss factors for early planning are often in the single-digit to low-teens percent range, but your project should use the best available efficiency data and the actual topology.
⚠️ Warning: Be careful with dual-cord equipment and redundant power supplies. Don’t double-count nameplate just because two PSUs exist; count expected draw under normal operation.
Lighting, occupants, envelope
These loads are usually smaller than IT heat in large halls, but they matter in:
small rooms
low-load early phases
edge/micro data centers with tight cooling margins
Lighting
If you don’t have a lighting design yet, estimate lighting power density and treat it as sensible heat.
Use floor area × assumed W/ft² (document the assumption)
Occupants
People add both sensible heat and some moisture. For peak sizing, use the maximum number of people expected at one time (install/maintenance events can be “worst case” even if the room is usually unmanned).
Envelope
Envelope gains are highly site-specific. They can be modest for interior white space and more significant for exterior walls/roofs with solar exposure. If your white space is internal with minimal exterior surface area, envelope can be small enough to treat as a conservative margin instead of a detailed calculation.
Done when:
You can list each non-IT contributor, the basis (design vs. measured), and whether it is peak or average.
Ventilation and humidity control
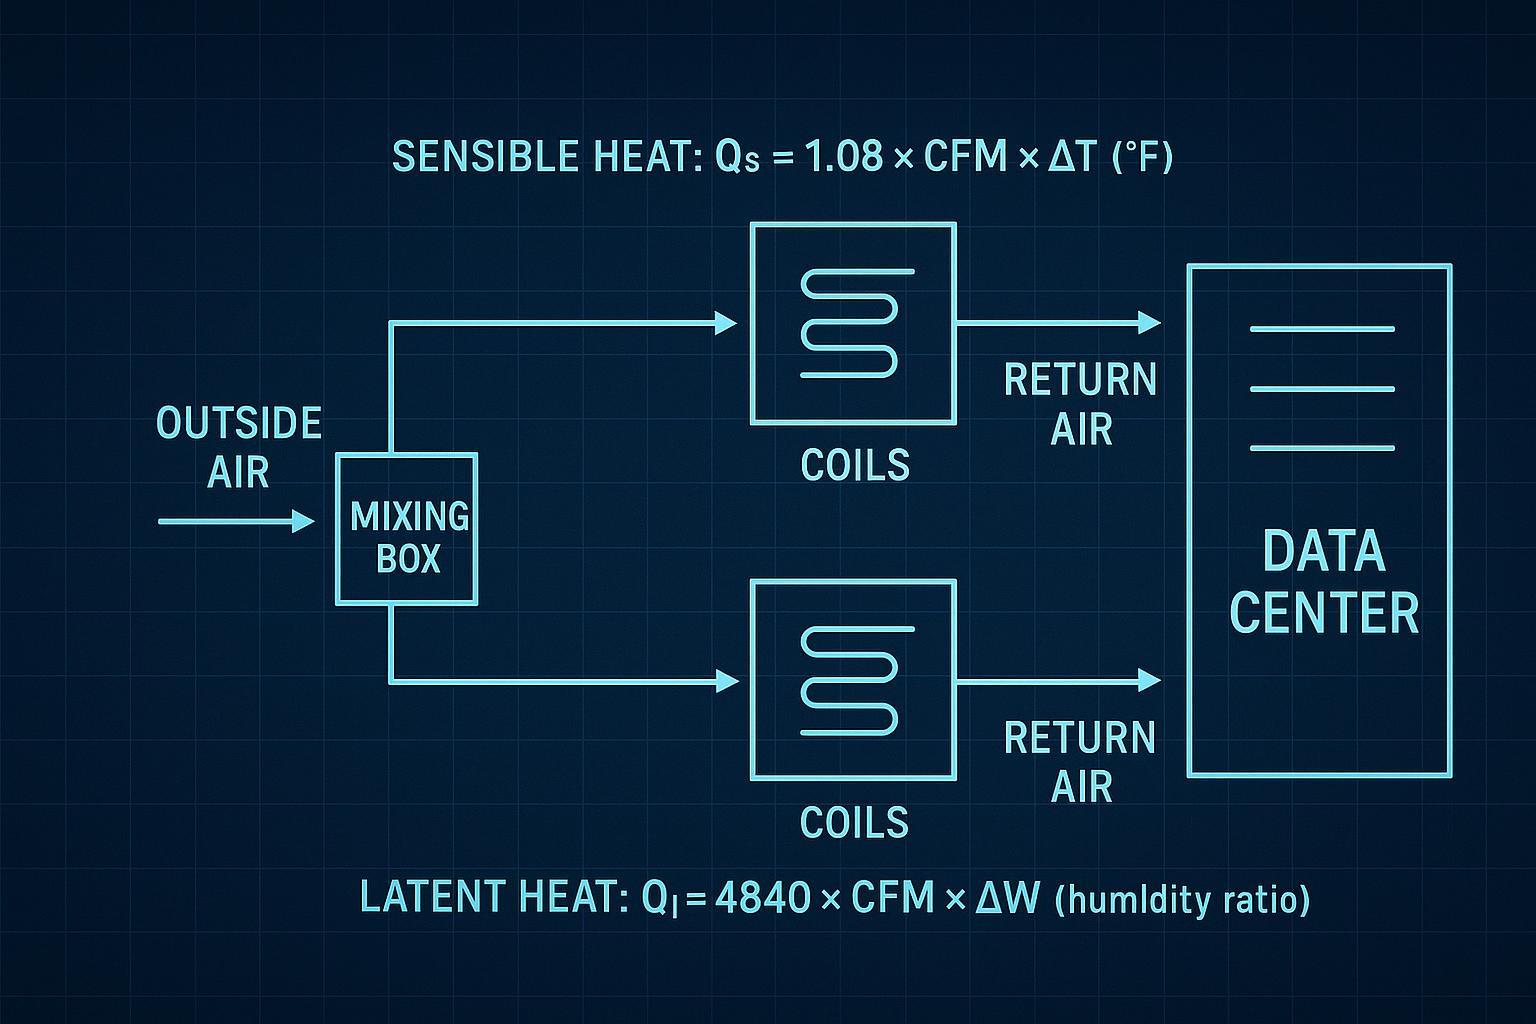
Ventilation and humidity control can introduce both sensible and latent components.
Sensible: changing air temperature
Latent: adding/removing moisture (dehumidification/humidification)
Two common engineering relationships (in IP units) are:
Sensible:
Qs (BTU/h) = 1.08 × CFM × ΔT (°F)Latent:
Ql (BTU/h) = 4,840 × CFM × ΔW(ΔW is humidity ratio change in lb water/lb dry air)
These constants come from air properties and unit conversions under standard conditions; if your site is at higher altitude, the effective constant changes with air density.
Done when:
You’ve explicitly stated whether latent load is negligible (common in many data halls) or material (outside-air rates, humidification strategy, climate).
Sum, convert, and size
Unit conversions and checks
A simple sequence that avoids unit mistakes:
Sum all kW heat contributors inside the boundary (IT + losses + non-IT).
Convert to BTU/h:
BTU/h = kW × 3,412.Convert to tons (TR):
TR = BTU/h ÷ 12,000.Sanity-check:
If your calculated cooling capacity is less than IT kW (with everything inside the boundary), you likely missed a conversion or a contributor.
If your result is wildly above IT kW for a typical air-cooled hall, check for double counting (e.g., nameplate + metered, or redundant PSUs).
Worked example path
Assume a new hall with a planned day-1 IT load and conservative headroom:
IT load (day-1 peak): 500 kW (documented budget)
Electrical losses inside boundary: 12% (UPS + distribution combined, placeholder until topology/efficiency is confirmed)
Lighting: 8 kW
People: 1 kW (peak event assumption)
Envelope: 0 kW (interior hall; treated via overall margin instead)
Ventilation/humidity latent: 0 kW (assumed negligible for first-pass; document outside-air strategy separately)
Sum kW:
Total kW = 500 × (1 + 0.12) + 8 + 1 = 569 kW
Convert to BTU/h:
569 × 3,412 ≈ 1,941,508 BTU/h (first-pass; keep significant digits appropriate for your design stage)
Convert to tons:
TR ≈ (569 × 3,412) ÷ 12,000 ≈ 569 × 0.284 ≈ 162 TR
Interpretation:
162 TR is your calculated heat removal requirement at the assumed peak.
Sizing and redundancy decisions come next; they change installed capacity and failure-tolerant capacity.
Redundancy and compliance
Safety margins and growth headroom
Separate these two ideas so stakeholders don’t argue past each other:
Safety margin: uncertainty in inputs, measurement error, and operational variability.
Growth headroom: deliberate expansion capacity (more racks, higher rack kW, higher utilization).
A practical way to document it is to maintain two numbers:
Day-1 required (based on current peak assumptions)
Design target (day-1 + growth, or a staged deployment plan)
N, N+1, 2N implications
Redundancy affects how you translate “required cooling” into “installed equipment.”
N: Installed capacity roughly equals required capacity (little to no failure tolerance).
N+1: You can lose one unit (or one module) and still meet required capacity if controls and airflow distribution support it.
2N: Two independent paths; higher resilience but higher capex/space/complexity.
The key is to state what failure you are protecting against (single CRAH failure, pump skid failure, chilled water interruption, etc.) and whether the remaining path can still deliver air where it’s needed.
ASHRAE 90.4 and climate‑zone notes
ASHRAE 90.4 is a performance-based energy standard built for data centers. The practical implication for load sizing is not that it changes physics—it changes expectations around:
mechanical system efficiency (fans, pumps, heat rejection)
climate-aware strategies (economizers, supply/return temperature strategy)
documenting the energy impact of design choices
If your project must demonstrate an energy-performance posture, align early with the compliance method and climate-zone assumptions so you don’t redesign late.
Airflow and temperature validation
Setpoints, sensors, and containment checks
A load calculation is only as credible as your ability to prove the delivered conditions.
Control to the rack inlet, not the room average
ASHRAE TC 9.9 emphasizes that what matters is the IT equipment inlet condition—hotspots are local, and “average room temperature” can be misleading.
Instrument the space so you can see mixing and stratification
Place inlet temperature sensors at representative racks (and at multiple heights) to catch stratification.
Trend supply/return temperatures at cooling units to confirm ΔT behavior.
Validate containment and leakage paths
Containment only works if bypass and recirculation are controlled:
blanking panels
sealed cable cutouts
aisle end doors/caps
controlled return path
In this context, it’s reasonable to note that integrated approaches—where containment, cooling distribution, and monitoring are designed together—tend to make validation easier. For example, solutions like Coolnetpower’s MetaRow modular data center explicitly integrate containment and monitoring as part of the packaged architecture, which can simplify airflow-isolation verification during acceptance.
For deeper airflow-isolation commissioning checks, see Coolnetpower’s aisle containment effectiveness guide.
Commissioning and ongoing monitoring
Treat validation as a lifecycle workflow:
Commissioning: confirm sensors, verify airflow delivery, and capture a baseline under representative load.
Operations: trend inlet temperatures, ΔT, and alarms; correlate excursions with workload and maintenance events.
A practical tie-in is to use a standard checklist for in-row and row-level cooling acceptance and trendability; Coolnetpower’s in-row cooling strategies guide is one example of how teams structure commissioning checks around sustained kW/rack and airflow management.
Conclusion
Key takeaways and common pitfalls to avoid
Start with the best IT power number you have—metered peak beats nameplate for planning.
Keep your model traceable: boundary, contributors, and assumptions must be written down.
Most data halls are sensible-dominant, but ventilation/humidity strategy is where latent can appear.
Redundancy decisions change installed capacity; define the failure you’re protecting against.
The calculation is not “done” until you can validate rack inlet temperatures and airflow distribution.
Common pitfalls:
Double-counting redundant power supplies or counting nameplate as “expected.”
Mixing day-1 and future growth without labeling which is which.
Treating the average room temperature as proof, instead of measuring at rack inlets.
Next actions and documentation checklist
Next actions:
Build a one-page “inputs & assumptions” sheet for stakeholder sign-off.
Plan a commissioning measurement pass (rack inlets, supply/return temps, containment leakage checks).
Sanity-check your inputs against a calculator/tool (as a cross-check, not as the authority), such as the Coolnetpower Data Center Cooling & Power Calculator.
Documentation checklist:
Boundary definition (what’s inside the load model)
IT load basis (metered/model/nameplate) and time window
Loss assumptions and equipment efficiency references
Non-IT load assumptions (lighting/people/envelope)
Ventilation/humidity strategy (sensible/latent)
Margin and growth policy
Redundancy intent (N/N+1/2N) and protected failure mode
Validation plan (sensor placement, trending, commissioning tests)