Table of Contents
ToggleIntroduction
Sizing a UPS for a data center is deceptively simple on paper: add up critical load, add a margin, pick a redundancy model, and you’re done. In practice, most sizing errors come from three places: using nameplate values as if they were measured reality, converting kW and kVA with the wrong power factor, and applying redundancy in a way that “double counts” capacity.
In this guide you’ll learn a step-by-step data center UPS sizing workflow that helps you avoid both overload risk and unnecessary overspend.
Who it’s for: US facility managers, electrical engineers, and IT leaders.
How you’ll apply it: measured load, PF-based kW→kVA, headroom, redundancy, runtime, and efficiency checks.
Key Takeaway: Right-sizing is less about picking a big number and more about documenting a repeatable workflow: measure, convert, margin, apply topology, validate runtime, then check efficiency and power quality.
Define and Measure Load
Inventory critical equipment
Start by defining what the UPS is actually protecting. In most data centers, that’s not “everything electrical”—it’s the critical path that must ride through an outage or transfer event.
Inventory at the level your single-line and operations team actually manage:
IT loads: servers, storage, network switches/routers, security appliances.
Critical support loads (only if they truly must be on UPS): controls for cooling systems, BMS/EPMS controllers, network management, critical lighting, etc.
Power path components that change the number: PDUs, STSs, transformers (losses and derating), and any “always-on” monitoring.
Document for each item:
Location/circuit (so you can reconcile against metering)
Steady-state kW
Peak kW (or peak current)
Observed or specified power factor (PF)
If you’re running modular architectures, it can help to align this inventory with the way capacity is purchased and expanded (for example, by hall, row, or busway segment).
Measure vs nameplate diversity
Nameplate totals are often the fastest way to oversize a UPS. Many devices are rated for worst-case maximum draw, while actual operating loads are typically lower.
A better approach is:
Measure real load (kW and PF) at the distribution point that corresponds to the UPS output (or downstream distribution) using your EPMS/branch-circuit monitoring, a power quality analyzer, or temporary metering.
Capture peaks intentionally: pick a measurement window that includes realistic high-load periods (planned batch jobs, patch windows, known traffic peaks).
Justify diversity—don’t assume it: diversity factors are context-dependent. A mixed enterprise workload may exhibit diversity; a uniform cluster or high-density compute profile may not.
If you must use nameplate values (early design or greenfield), treat that as a conservative placeholder and plan to replace it with measurements before final procurement.
Convert kW and PF to kVA
UPS capacity is often discussed in both real power (kW) and apparent power (kVA). If you size only in kW without confirming PF, you can end up short on kVA (or vice versa). This is the core of UPS kW vs kVA decisions.
The core relationship is:
kW = kVA × PF
kVA = kW ÷ PF
So if your measured critical load is 180 kW at PF 0.95, the apparent power is:
kVA = 180 ÷ 0.95 ≈ 189.5 kVA
Practical engineering guidance such as the Fuji Electric UPS sizing calculation guide (linked above) treats PF as a real input to sizing math, not a default assumption.
Capacity and Headroom Math
Key Takeaway: For data center UPS sizing, do the kW→kVA conversion and margin math first, then choose a topology that keeps your normal operating point in a healthy efficiency band.
Data center UPS sizing: kW↔kVA with real PF
Two power factors matter in real projects:
Load PF: what your critical load actually draws (measured at the relevant point).
UPS output rating PF: what the UPS can deliver (confirm on the datasheet).
This is the practical core of UPS power factor sizing: you want the conversion math and the UPS rating limits to use the same assumptions.
In sizing reviews, confusion happens when someone converts using one PF in one step and a different PF in the next step. Avoid that by writing the PF you’re using alongside every conversion.
A defensible approach:
Convert measured kW to kVA using measured PF.
Confirm the UPS architecture covers both kW and kVA requirements.
Set growth and aging margin
Your “margin” should be purposeful, not a single magic percentage.
Common drivers that deserve explicit headroom:
Growth: planned IT expansion, new racks, new tenants.
Configuration drift: small adds over time that never trigger a redesign.
Measurement uncertainty: metering error bands, incomplete inventory.
Dynamic load events: short peaks during boot or failover.
Rather than stacking multiple generic margins, write one combined margin and justify it.
Illustrative approach:
Base load (measured peak): 190 kVA
Planned growth (18 months): +15%
Transient/load uncertainty: +10%
Combined target:
Required capacity before topology = 190 × (1 + 0.15 + 0.10) = 237.5 kVA
Operate in 60–80% load band
UPS efficiency is not a single fixed number; it follows a curve based on load factor. ENERGY STAR notes that a UPS does not always operate as efficiently as its headline rating suggests because its efficiency follows a curve as load changes (see ENERGY STAR guidance on reducing UPS energy losses).
Many operators aim to keep normal operation in a practical band like 60–80% because it balances:
better part-load efficiency than very low loading
headroom for short peaks
thermal margin and component stress management
Modular UPS architectures can help here: you can add modules as load grows and keep active modules in a healthier operating range.
For deeper selection factors around modular systems (efficiency curves, redundancy, and lifecycle tradeoffs), see Coolnetpower’s internal resource: modular UPS buyer’s guide.
Redundancy Topology Selection
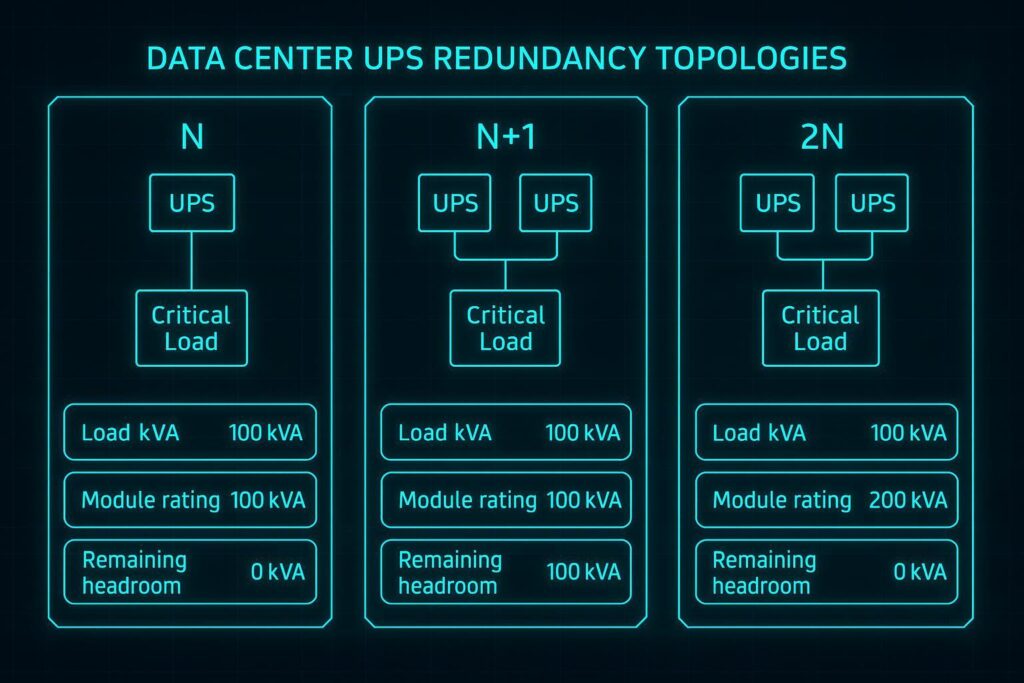
N, N+1, and 2N explained
Redundancy decisions should be made after you’ve calculated the required kW/kVA (including justified headroom). Otherwise you risk “designing by topology” and backing into a load number that isn’t real.
N: exactly enough UPS capacity to support the critical load.
N+1: enough capacity to support the critical load plus one additional module/unit, so you can lose one module (or take it out for maintenance) without dropping load.
2N: two independent UPS systems, each capable of carrying the full critical load.
If you want a refresher on redundancy language used across modular and edge designs, Coolnetpower’s guide on N, N+1, and 2N redundancy models is a useful baseline.
Apply redundancy without double count
Here’s the sizing trap: teams add “+25% headroom” and also select 2N, then assume the whole site has twice the load plus extra margin—without realizing that in 2N the installed capacity is doubled by design.
When stakeholders debate N+1 vs 2N UPS topology, keep the workflow consistent:
Compute required capacity (kVA and kW) for the critical load, including justified headroom.
Apply redundancy topology as an architectural decision.
Confirm the operating point of each UPS/module under normal and failure states.
Illustrative example:
Required capacity before topology (after margins): 240 kVA
Now apply topology:
N: provision ~240 kVA.
N+1: provision N modules so that with one module out, remaining capacity still ≥240 kVA.
2N: provision two separate 240 kVA paths; each must be able to carry 100% on its own.
Dual-cord distribution notes
Most modern IT loads are dual-cord, but that does not automatically make your architecture 2N.
Key checks:
Are the A and B feeds truly independent end-to-end (UPS, distribution, breakers, maintenance bypass)?
Is there any shared point of failure (common STS, shared distribution section, shared upstream transformer)?
What is your operational policy during maintenance (do you intentionally transfer all load to one path)?
If you expect to run on one path during maintenance, confirm that one path can carry the full load at the load factor you accept, not “in theory at 100% with no margin.”
Runtime and Battery Decisions
Generator strategy and autonomy
Runtime is not a vanity metric. It should match one of these operational goals:
ride-through until generator starts and stabilizes
ride-through until an ATS/STS transfer completes
time for controlled IT shutdown
time for an operator response window (unattended sites)
Before selecting a runtime target, write down generator assumptions:
start time distribution (best case / typical / worst case)
minimum stable output time
transfer logic (open transition vs closed)
whether you shed non-critical loads during outage
VRLA vs lithium aging impact
Battery chemistry changes how you should think about end-of-life behavior, footprint, and replacement cycles.
Two practical points that matter for sizing:
End-of-life capacity planning: Vertiv recommends tracking UPS batteries and replacing them when they can no longer supply about 80% of rated capacity (see Vertiv’s guidance on common UPS battery mistakes).
Temperature sensitivity: VRLA life is strongly affected by temperature; white papers such as Riello’s Lifespan of Batteries in UPS systems summarize why higher operating temperature materially shortens service life.
Validate runtime with vendor curves
A spreadsheet that converts Ah to minutes is useful for back-of-the-envelope planning, but it’s not a substitute for the UPS vendor’s runtime curves.
For UPS runtime battery sizing, document the three things you’re validating:
runtime minutes at the actual protected load (kW and PF)
assumptions for temperature and end-of-life capacity
the OEM runtime/discharge curve (or tool output) used to back the commitment
Why curves matter:
battery capacity depends on discharge rate
inverter and conversion losses vary by design
cutoff voltage and usable depth of discharge are model-specific
Engineering guides like the Fuji Electric UPS sizing calculation guide (linked above) also emphasize applying factors for aging and temperature when sizing batteries.
Coolnetpower example (non-promotional): Coolnetpower approaches UPS sizing as one workflow—meter the real load, choose modular capacity, validate runtime with OEM curves, and map redundancy so margins aren’t double-counted.
Efficiency, Power Quality, and Environment
UPS efficiency at part load
When redundancy is involved, many sites spend most of their time at partial load. That makes part-load efficiency more important than a single “max efficiency” headline.
Use these checks:
Ask for the efficiency curve at your expected operating point (for example, 40%, 60%, and 80%).
Confirm how efficiency changes under N+1 operation (fewer modules online vs all modules online).
Treat wasted power as heat that must be removed—this affects cooling and battery room temperature.
Harmonics/THDi and generators
Even if your UPS can handle distorted input current, harmonics and THDi can still matter for upstream equipment and generator interactions.
Practical checks:
Confirm UPS input characteristics and any harmonic mitigation approach.
Coordinate with generator sizing and voltage/frequency tolerance.
Validate bypass and transfer behavior under realistic conditions during commissioning.
Thermal and battery life factors
Battery performance and service life are environment-sensitive.
Checklist items to include in design review:
battery room (or cabinet) ambient temperature ranges across seasons
ventilation and hotspots inside battery cabinets
maintenance access and replacement plan
monitoring: temperature, internal resistance trends, and discharge event logs
Worked Example and Checks
Step-by-step sizing example
Below is an illustrative example to show the workflow. Substitute your measured values.
Inputs (illustrative):
Measured critical load: 180 kW
Measured PF: 0.95
Growth margin: 15%
Additional headroom for uncertainty/transients: 10%
Step 1 — Convert to kVA:
Base kVA = 180 ÷ 0.95 = 189.5 kVA
Step 2 — Apply headroom:
Target kVA before topology = 189.5 × (1 + 0.15 + 0.10)
Target kVA ≈ 189.5 × 1.25 = 236.9 kVA
Step 3 — Choose a working load band:
If you want normal operation around 70% load:
Installed “effective” capacity per protected path ≈ 236.9 ÷ 0.70 ≈ 338.4 kVA
Redundancy and runtime verification
Now apply topology and validate what happens during failures/maintenance.
Example logic:
If N+1 modular, confirm that with one module out, remaining capacity still ≥ your required capacity, and that remaining modules don’t end up near 100% load.
If 2N, confirm each path can carry the full requirement (after margins), and document how you balance A/B during normal operations.
For runtime:
Decide required minutes based on generator and transfer strategy.
Validate runtime against vendor runtime curves at your actual load point.
Include aging and temperature assumptions in the runtime commitment.
Final compliance review
A final review can be as simple as confirming you have written answers to these questions:
Do we have measured kW and PF for the protected load (or a documented placeholder with a plan to measure)?
Is kW→kVA conversion documented with the PF used in each step?
Are margins justified (growth vs uncertainty vs transients) without stacking arbitrary percentages?
Is redundancy applied to the final required capacity (no double counting)?
Will normal operation land in a reasonable efficiency band given the redundancy configuration?
Is runtime validated using OEM curves at the intended load point and at end-of-life assumptions?
Are power quality and generator interactions addressed in commissioning scripts?
If you need a structured way to document commissioning activities (roles, FAT/SAT/IST scripts), Coolnetpower’s micro data center deployment playbook provides a useful template mindset that can be adapted to UPS projects.
Conclusion
Right-sizing a data center UPS is a repeatable workflow:
measure the load
convert to kVA using real PF
add the right headroom
choose the redundancy topology and apply it without double counting
set runtime targets based on operations and validate with vendor curves
check efficiency at your true operating point and confirm power-quality/environmental assumptions
Next steps:
Validate OEM runtime curves at your intended load point and at end-of-life assumptions.
Coordinate generator start/transfer behavior with the UPS and bypass strategy.
Plan maintenance and monitoring so your capacity and runtime assumptions remain true over time.
If you’d like, share your measured kW/PF plus target runtime and redundancy, and we can translate it into a defensible sizing worksheet for design review.