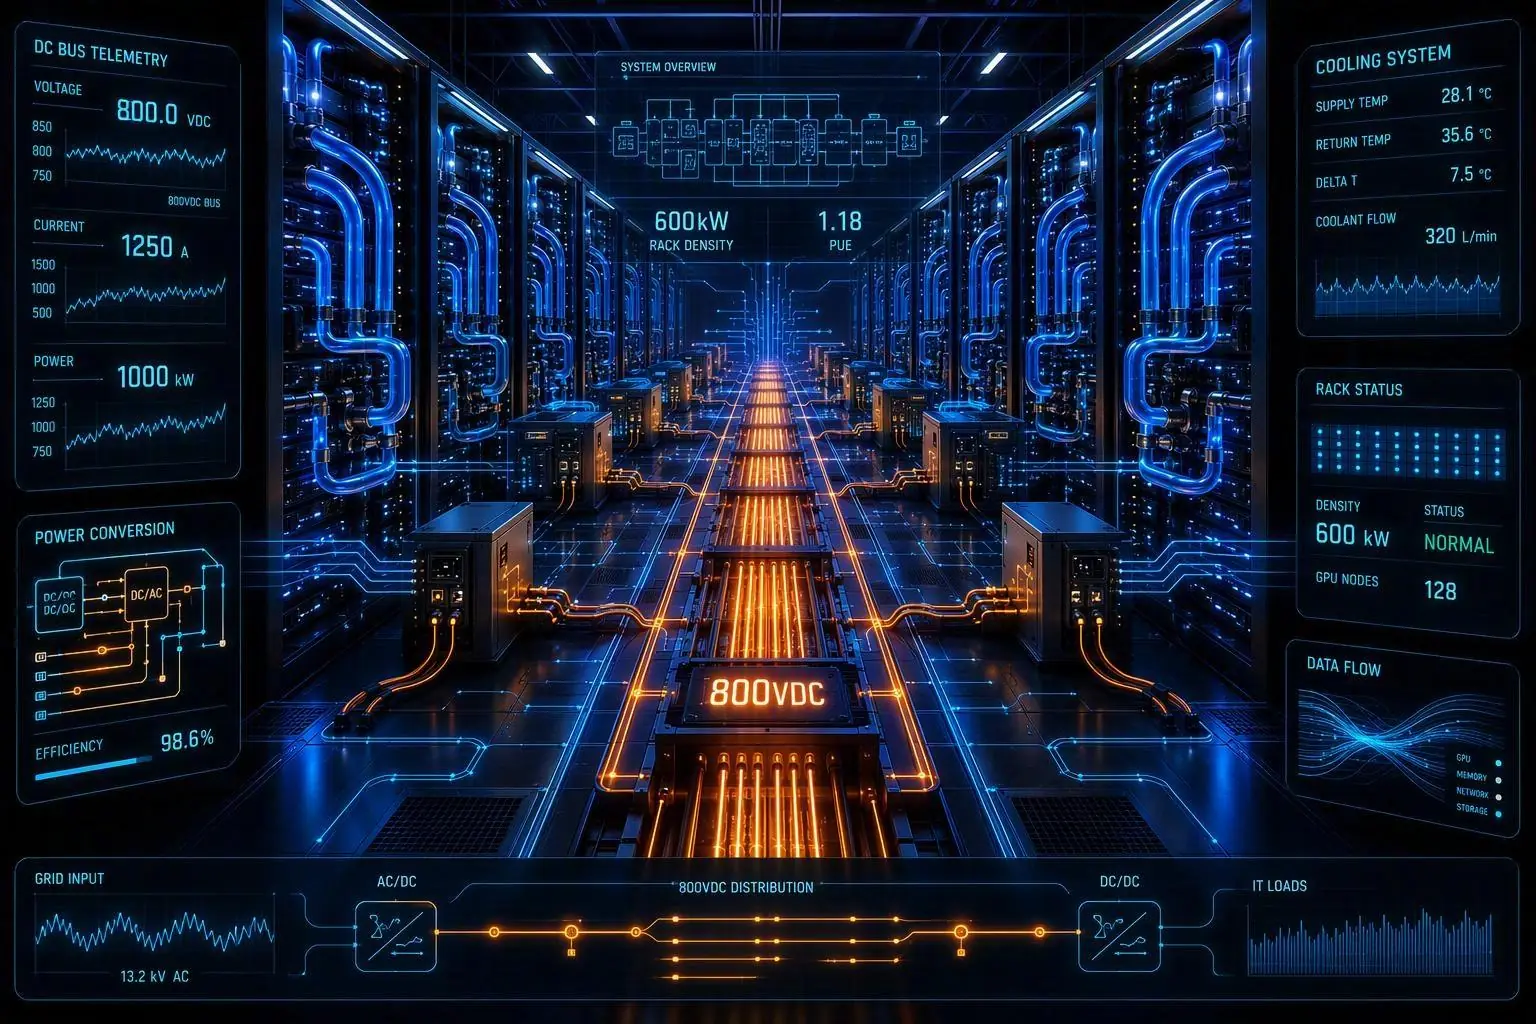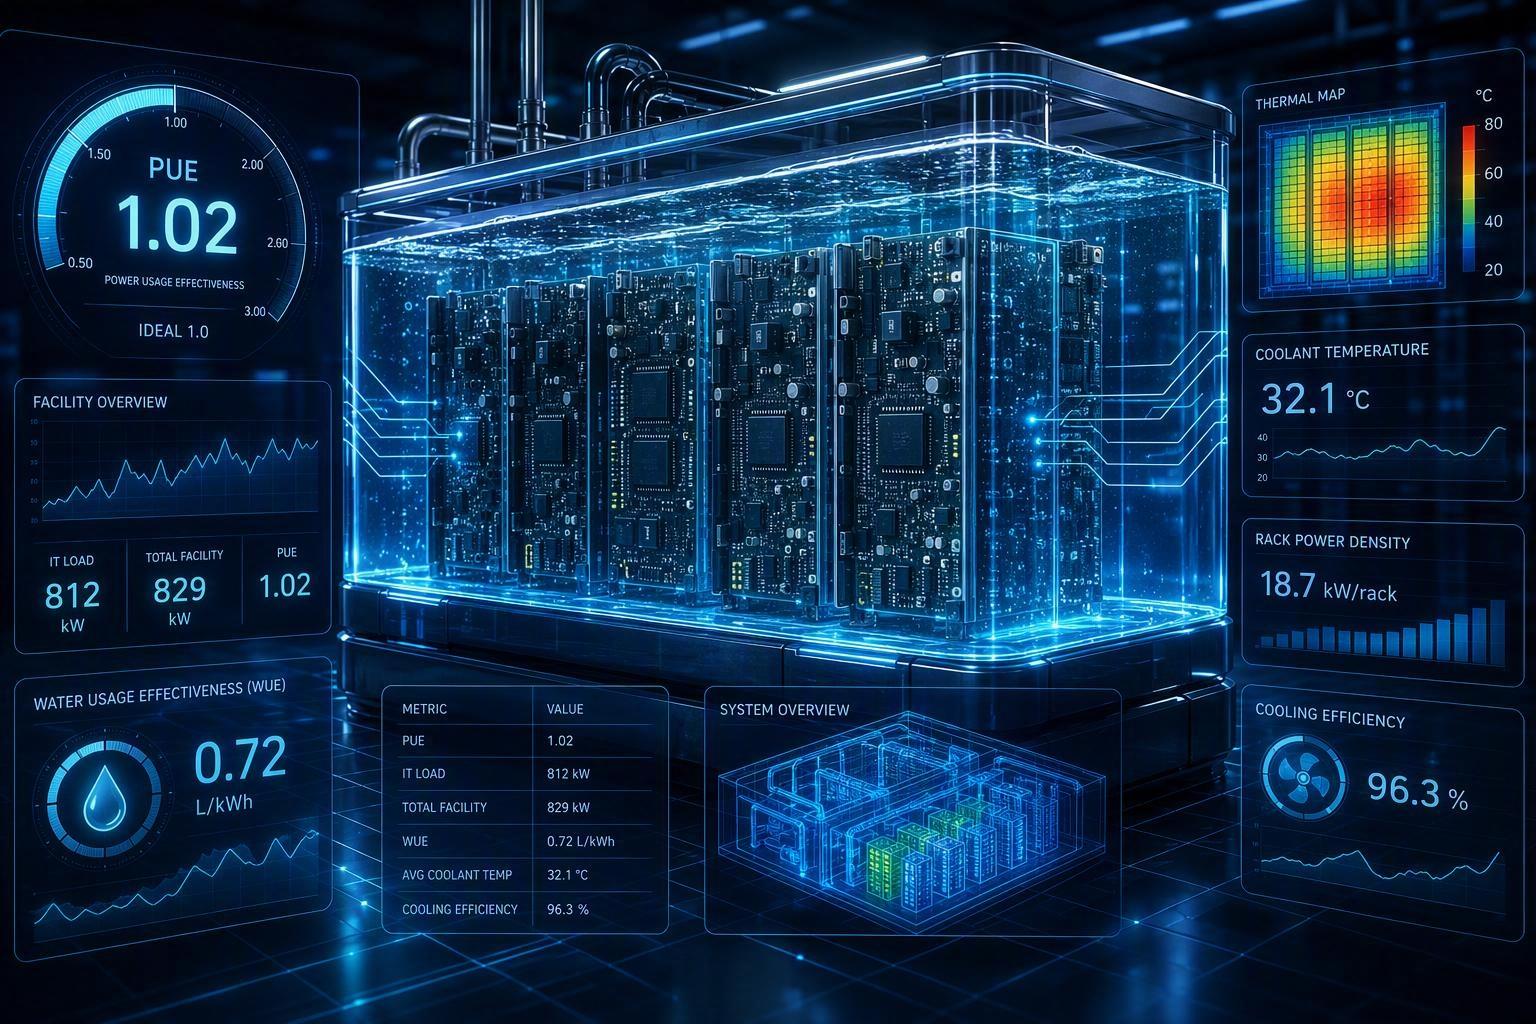
Site power, not rack density, is the binding constraint on AI build-outs. Once a facility’s utility allocation is fixed, the question stops being how many kilowatts a rack can hold and becomes how many useful GPUs that megawatt can deliver. Per-component metrics no longer answer it: a UPS efficiency figure and a precision cooling capacity figure can both look strong while the assembled system delivers far less compute than the arithmetic suggests. Vertiv’s engineering guidance is explicit that power, cooling, white space and controls must be designed as one system to handle dynamic AI loads, and that the infrastructure must flex across multiple compute generations without anchoring to a single silicon ecosystem (Vertiv, retrieved 2026-08-09).
This guide is a comparison instrument, not a product pitch. It works through four decisions: converting a constrained megawatt into a defensible GPU-count planning figure; comparing legacy per-component metrics against end-to-end deliverable density; zoning air cooling against liquid cooling where each stops working; and placing the module boundary inside a prefabricated block. The unit of account is tokens per megawatt, which Vertiv defines as useful inference throughput relative to a facility’s provisioned power budget, calculated as useful inference tokens per second divided by provisioned utility power, so it counts all-in utility power rather than IT load alone (Vertiv, retrieved 2026-08-09). Every figure below carries a named source, its date and its conditions; where the record is thin, the guide says so and gives the qualitative answer instead.
Who prepared this guide. This evaluation framework was compiled by the engineering and solution-design team at Coolnetpower, a data center infrastructure provider with more than 15 years of experience across precision cooling, modular and micro data centers, and rack power systems, deployed in communication rooms, smart-city and energy-management projects. The team’s perspective is that of an integrator that has to make power, thermal, white-space and control interfaces work together on real sites, which is why the guide is organized around interfaces and derating arithmetic rather than product categories. Read it as practitioner-built procurement scaffolding, not as an independent academic review.
Method and disclosure. Figures in this guide are drawn from named public sources (Vertiv, AFCOM, Uptime Institute, ASHRAE, LBNL/GSA, and TIA), each cited with its publication or retrieval date, and are labeled either as a cited value or as an explicit planning assumption. Where a widely quoted number rests on a survey sample rather than a measured fleet, the guide says so. Coolnetpower sells data center equipment that overlaps with several architectures discussed here, so treat vendor-framed claims — and ours — as worth checking against your own site conditions. The framework is current as of September 2026; density figures and the pending ANSI/TIA-942-C addendum move quickly, so re-verify time-sensitive values before they enter a specification.
This guide is a comparison instrument, not a product pitch. It works through four decisions: converting a constrained megawatt into a defensible GPU-count planning figure; comparing legacy per-component metrics against end-to-end deliverable density; zoning air cooling against liquid cooling where each stops working; and placing the module boundary inside a prefabricated block. The unit of account is tokens per megawatt, which Vertiv defines as useful inference throughput relative to a facility’s provisioned power budget, calculated as useful inference tokens per second divided by provisioned utility power, so it counts all-in utility power rather than IT load alone (Vertiv, retrieved 2026-08-09). Every figure below carries a named source, its date and its conditions; where the record is thin, the guide says so and gives the qualitative answer instead.
Key Takeaways
Site power is the binding constraint, so plan in GPUs per megawatt rather than in rack kilowatts.
Per-component metrics such as UPS efficiency and precision cooling capacity do not predict assembled deliverable density.
Tokens per megawatt counts provisioned utility power, not IT load, which makes it comparable across designs.
Four decisions follow: MW-to-GPU conversion, metric comparison, air-versus-liquid zoning, and module boundary placement.
Numbers appear only where a named source supports them, with date and test conditions attached.
Table of Contents
ToggleWhat integrated data center infrastructure for AI compute density actually means
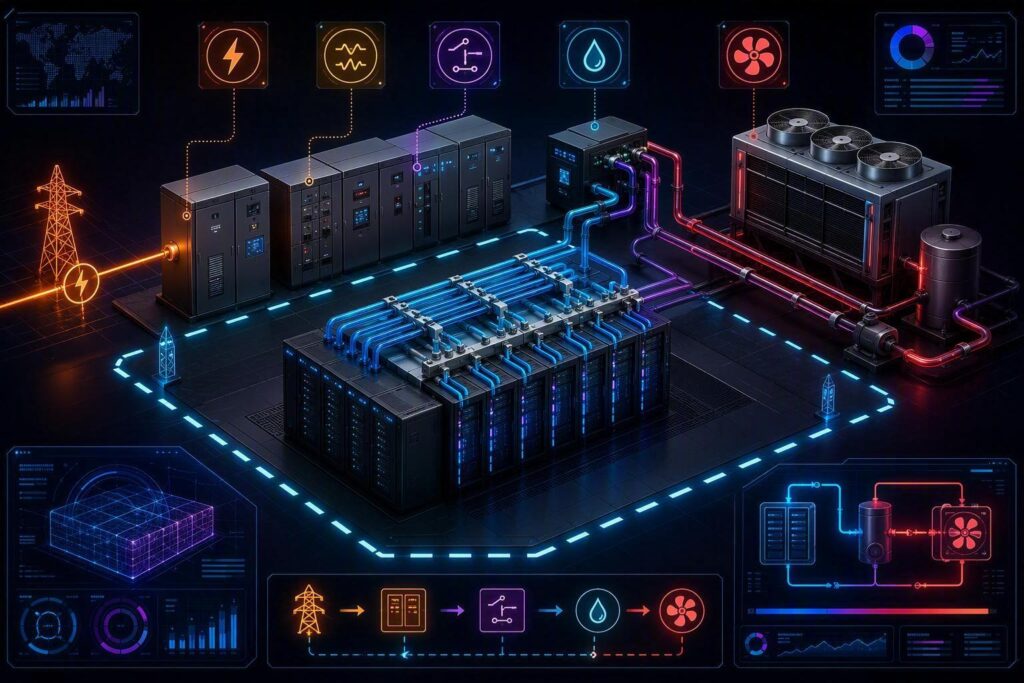
Integrated data center infrastructure for AI compute density means the power path, the thermal path, the white space and the controls are designed as one system rather than procured as four separate line items. As Vertiv frames the integrated-system requirement, power, cooling, white space and controls must be designed as one system to handle dynamic AI loads, and the infrastructure has to flex across multiple compute generations without anchoring to a single silicon ecosystem. That second clause is the one buyers underweight: a hall that only fits today’s accelerator generation is a stranded asset the moment the roadmap turns.
The unit of account for that system is tokens per megawatt, which Vertiv defines as useful inference throughput measured against a data center’s provisioned power budget rather than against IT load alone. The distinction matters because it counts the utility power you actually pay for, including the cooling and distribution overhead that per-rack figures hide.
Key Takeaway: Integrated infrastructure means the power path, thermal path, white space and controls are designed as one system that can flex across compute generations. Tokens per megawatt = useful inference tokens per second ÷ provisioned utility power, not IT load.
Three components carry the evaluation:
Power path. UPS, distribution and the backup capacity that keeps cooling support loads running, which is where UPS and liquid cooling integration for high-density racks is won or lost.
Thermal path. Precision air, direct-to-chip, rear-door heat exchangers or immersion, chosen against rack density rather than habit.
Module boundary. What ships prefabricated versus what is built on site.
“Integrated” describes interfaces, not a single supplier. One vendor is one way to get designed-together interfaces; it is not the definition.
Why per-component metrics stop predicting deliverable compute density
A UPS efficiency rating and a precision-cooling capacity rating are both measured at the component. Your constraint is measured at the meter. The gap between those two points is where density is won or lost, and it is why component datasheets increasingly fail to predict what a floor can actually deliver.
The published industry averages make the problem worse, because they do not agree with each other. Uptime Institute’s 2026 survey of more than 1,600 data center professionals puts modal rack density at 11 kW and average density at 7.8 kW once facilities designed above 30 kW are excluded. AFCOM’s 2026 State of the Data Center findings report a 27 kW average, up from 16 kW the prior year, the largest jump in ten years of that research. Both are real; they describe different populations, and the gap is method as much as market. AFCOM’s mean is built from a membership survey that has tilted increasingly toward AI and high-density planning, and it reports density closer to measured peak kW load; Uptime samples a broader global operator base and reports the most common (modal) rack density, excluding the small set of facilities designed above 30 kW. Uptime’s own 2024 data shows how sensitive the mean is to outliers: the average typical rack density sat near 8 kW, but dropped to about 7.1 kW once sites above 50 kW were removed. The practical takeaway for procurement is that neither number describes the hall you are being asked to build. A 27 kW mean tells you what AI-forward respondents are designing toward; a 7.8 kW average tells you what the installed base typically runs. If your facility is a retrofit of general-purpose space, plan against the installed-base figure and treat the AI mean as the ceiling you are trying to reach; if you are building greenfield for a known accelerator platform, the design density governs and both survey means are context only.
Vendor projections run further ahead still. Vertiv’s analysis of AI rack architectures traces racks from 35 kW to 140 kW today, toward 240 to 250 kW in newer designs, with near-term designs expected at 300 to 600 kW and some projections above 1 MW by 2030. Treat that ladder as a projection, not a forecast you can size against.
The failure mode is straightforward: a buyer who plans from a component figure or an industry mean discovers the shortfall at commissioning, when the racks are already installed. The comparable unit is deliverable compute per constrained megawatt, which is what GPUs per megawatt data center planning has to estimate, and every section that follows is a way to estimate it.
How to convert a constrained megawatt into a GPU-count planning figure
GPUs per megawatt data center planning is a chain of derating steps, not a single conversion factor. Each step below is an assumption you can challenge, and the answer moves more when you change the denominator than when you change the hardware.
Start with provisioned utility power, then subtract the overheads that never reach a GPU: facility PUE, power-conversion and distribution losses, and the cooling support load (CDU pumps, controls, heat rejection). What remains is IT load available to racks. Divide by rack power per GPU platform to get GPUs per rack, then by racks per hall.
Scale Venture Partners frames the goal as getting more chips per megawatt online through better cooling, power, and facility optimization, and notes that GPUs per megawatt is only meaningful once the denominator is defined. In the one example they cite, GPU chips were about 40% of total facility power, so the same megawatt yields very different chip counts depending on whether you count chips, IT load, or total facility draw.
Derating step | Illustrative value | Basis and industry reference range | Source |
|---|---|---|---|
Provisioned utility power | 1 MW | Contracted capacity, not average draw | Planning assumption |
PUE | 1.3 | Optimized air-cooled halls run 1.2–1.4; traditional air-cooled 1.4–1.6; DLC 1.05–1.15. 1.3 sits at the efficient end of air cooling | ASHRAE AI Data Center Framework; Uptime Institute survey |
Conversion and distribution losses | 5-8% | UPS and PDU topology; modern high-efficiency UPS keeps the top of the band | Planning assumption |
Cooling support load | 10-15% of IT load | CDU pumps, controls, heat rejection; air-cooled cooling can add 0.5 to PUE | Planning assumption |
IT load available to racks | ~700 kW | Derived from the rows above | Arithmetic |
Rack power per GPU platform | 40-130 kW | Current AI racks span 35–140 kW, with newer designs toward 240–250 kW | Vertiv AI rack-architecture analysis |
GPUs per rack | 8-72 | Vendor configuration | Planning assumption |
Racks per hall | ~5-17 | Derived from IT load and rack power | Arithmetic |
Choosing 1.3 rather than the 1.4–1.6 industry average is a design target, not a default: it assumes a contained, efficiently cooled hall. In a legacy facility running above PUE 1.5, the same 1 MW yields visibly fewer usable racks, which is why the PUE row is the first one to re-run when the site is a retrofit.
The estimate stops being useful when any input is treated as fixed. A 1.3 PUE assumption collapses in a hall that was never designed for integrated data center infrastructure for AI compute density, and rack power per platform is a moving target across GPU generations. Treat the table as a sensitivity model: change one row, rerun the chain, and show finance the range rather than a single number.
A working decision tree. In practice, the derating input that moves the answer most is not the GPU choice — it is the denominator and the PUE path, and both are set before any hardware is specified. The sequence we use with buyers runs like this: if the site is a legacy retrofit, fix PUE first by measuring the existing plant, because a PUE shift from 1.5 to 1.3 changes usable IT load by roughly 13% on the same megawatt — more than most single-generation GPU efficiency gains on the market roadmap. If the site is greenfield, fix the rack power target from the accelerator platform and work backward to the required cooling and power distribution. Only then does the per-component metric matter, because by that point it is being selected against a known load rather than used to estimate one. Running the chain in the opposite order — starting from a component datasheet — is how buyers arrive at commissioning with racks they cannot power or cool.
Comparing architecture options against explicit evaluation criteria
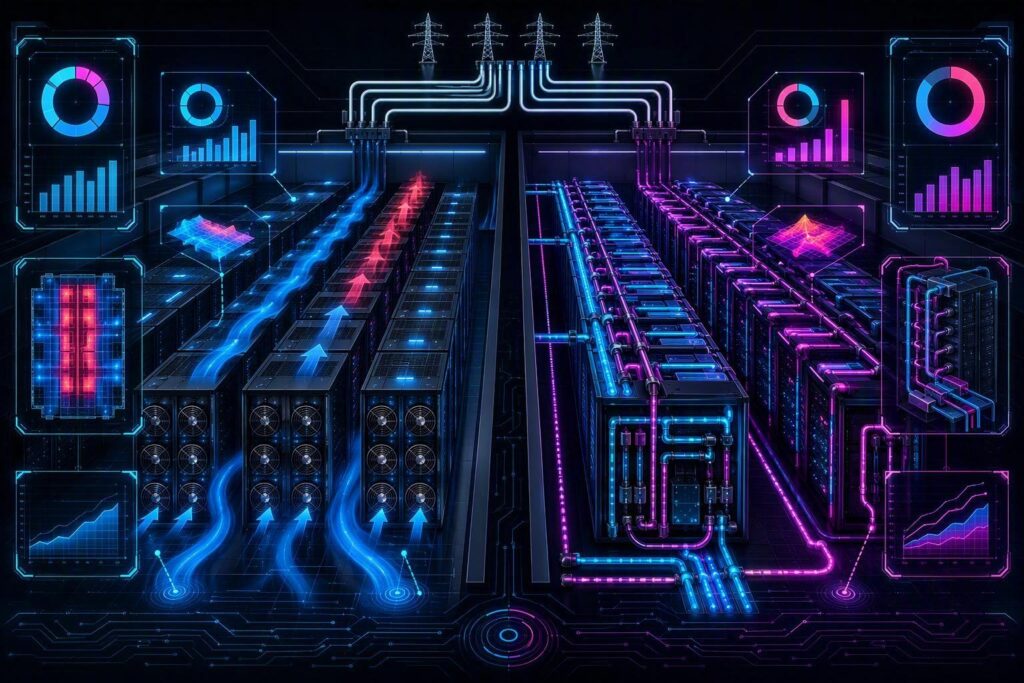
Build the matrix before you look at any option, because the criteria decide the comparison, not the other way around. Six criteria carry most of the weight: deliverable kW per rack after derating, the heat-rejection temperature delta your site can actually supply, retrofit feasibility in an existing hall, the commissioning and maintenance access path, redundancy topology and what it costs in usable capacity, and monitoring visibility into the thermal and power path. The redundancy row is where UPS and liquid cooling integration for high-density racks gets decided, because N+1 and 2N topologies consume different amounts of the same constrained envelope.
ASHRAE’s AI Data Center Framework recommends deploying liquid cooling and thermally segmented zones to support 50–100+ kW racks, and using a Technology Cooling System above 50–120 kW per rack. That is a density threshold, not a product recommendation, and it leaves the choice of mechanism open.
Criterion | Air-only | Air + RDHx | Direct-to-chip | Immersion | Prefabricated MDC |
|---|---|---|---|---|---|
Deliverable kW/rack after derating | Lowest ceiling | Moderate gain, air loop retained | High, limited by CDU and TCS capacity | High, tank-specific | Set by block design |
Heat-rejection delta available on site | Needs large delta | Needs moderate delta | Needs chilled or facility water | Needs secondary loop | Depends on block heat rejection |
Retrofit feasibility | Easiest | Moderate; door depth and piping | Hard; manifolds and CDU | Hardest; tank handling | New build or yard space |
Commissioning and maintenance access | Familiar | Familiar | New procedures, leak response | New procedures | Factory-tested, site-limited |
Redundancy topology cost in usable capacity | N+1 cheap, 2N costly | Similar to air | N+1 CDU often sufficient | Pump and loop redundancy | Defined at block level |
Monitoring and DCIM visibility | Mature | Mature | Needs TCS telemetry | Needs loop telemetry | Unified if integrated |
The precision cooling vs liquid cooling for GPU racks question is not a straight contest. The precision-versus-direct-to-chip distinction frames precision cooling as engineered around the rack and its hot spots, while direct-to-chip cools CPUs and GPUs only and leaves some in-chassis components air-cooled. Treat that as vendor framing: the source sells one of the two categories.
Adoption is already split rather than sequential. AFCOM’s 2026 State of the Data Center findings put 36% of respondents with liquid cooling implemented and 28% planning adoption within 12 to 24 months, with rear-door heat exchangers and immersion each cited by 37%.
Failure modes differ by row. Air-only fails on the derating row first. Direct-to-chip fails when the TCS is sized for the compute load but not for commissioning and leak response. Prefabricated blocks fail when the block boundary was fixed before the redundancy topology was chosen.
Where the air-to-liquid transition actually happens, and what breaks first
The air-to-liquid transition starts where integrated data center infrastructure for AI compute density runs out of cooling headroom, and that point arrives well before floor space does. AFCOM’s analysis of the air-cooling ceiling (2026) puts the practical limit at roughly 40 kW per rack: beyond that, moving toward 50 kW and higher, traditional airflow strategies struggle, and many facilities were never designed for 100 kW racks, let alone 600 kW platforms. The same analysis is blunt about the ordering of constraints, noting that operators run out of cooling headroom before they run out of space, because the bottleneck is thermal rejection and power distribution rather than square meters.
That reframes the transition as a power problem with a thermal symptom. AFCOM’s density analysis makes the same point from the other direction: facilities designed for 10 to 15 kW per rack five years ago cannot host current AI racks, regardless of how much white space is free.
Four failure modes show up first, and each is a check you can run before committing to a design:
Stranded breaker and busway capacity. The rack position exists, but the upstream protective device and busway plug-in cannot carry the new current.
CDU supply-temperature and flow limits. The available supply temperature forces a higher approach temperature than the site’s heat rejection can absorb.
VFD harmonics. Variable-frequency drives on CDU pumps inject harmonics that need isolation or filtering to stay within limits.
Cooling support loads left out of UPS sizing. This is where UPS and liquid cooling integration for high-density racks most often goes wrong.
On that last point, the engineering practice is straightforward: PDUs, breakers, cabling and backup power must be sized for the IT load plus cooling support equipment, since CDUs sometimes sit on battery-backed power, and UPS gear itself produces heat that often needs its own cooling zone.
Zoning and the module boundary: what belongs inside the prefabricated block
Zoning and the module boundary are the same decision made at two scales: which loads share a thermal environment, and which subsystems ship assembled and tested. Prefabrication moves power and cooling blocks into the factory, where they are assembled and tested before site installation, cutting schedule, workforce and permitting risk and letting capacity be added in repeatable blocks sized to the power actually available rather than to a forecast, according to LBNL and GSA’s modular data center procurement guidance.
That distinction matters because the constraint is upstream of the building. US data centers consumed roughly 180 TWh in 2024 and are on track for about 430 TWh by 2030, while grid interconnection runs 4 to 8 years and a 500 MW request provisions 500 MW at all times, per the grid-interconnection bottleneck described by Scale Venture Partners. A modular data center for a constrained power envelope should therefore be sized in increments that match secured megawatts, not forecast demand.
Four boundary criteria decide the split. Whether the CDU and heat rejection sit inside the block or on the roof sets maintenance access and pipe runs. Whether the UPS is block-local or hall-level sets fault isolation. How the block interfaces to site power and to monitoring determines commissioning effort. Fixing the boundary early buys repeatability and costs you the ability to rebalance loads across halls later.
For the specification itself, the ANSI/TIA-942-C addendum on AI, targeted for mid-2027 scopes high-density cabling and cooling and electrical systems including liquid cooling, with no numeric density figures stated, and the ISO/IEC 22237 data centre facilities family supplies the classification and efficiency vocabulary a procurement spec can cite.
A procurement-ready evaluation sequence
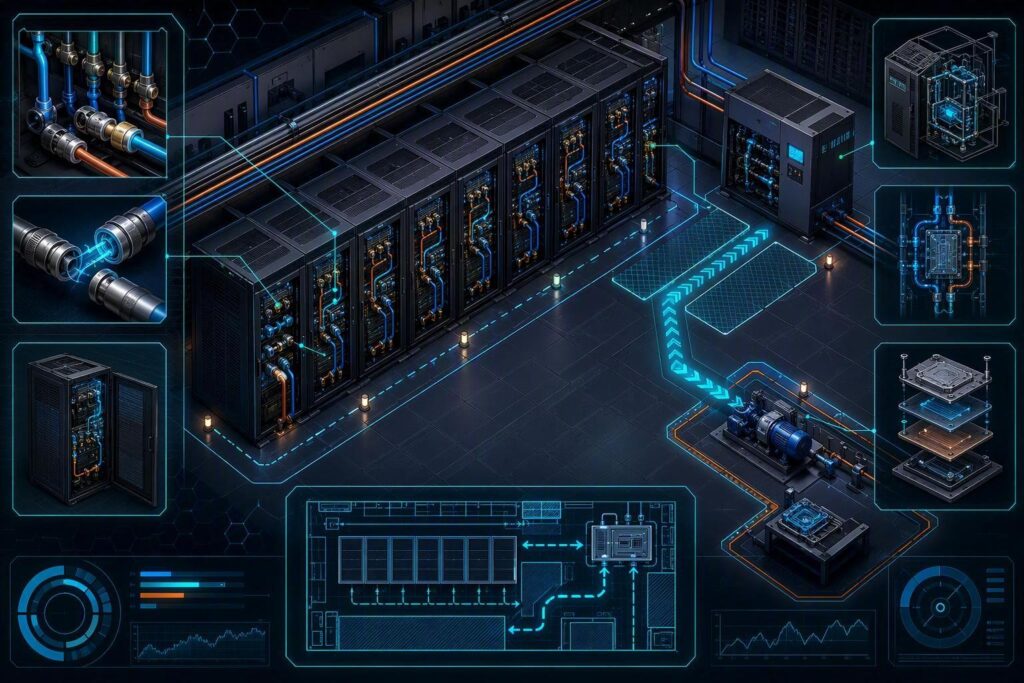
Run the evaluation in this order, because each step constrains the next: integrated data center infrastructure for AI compute density is only comparable once the denominator, the site limits, and the derating rules are fixed. Reverse the sequence and suppliers answer different questions with different numbers.
1. Fix the denominator. Decide whether planning figures are quoted per IT load or per provisioned utility power, then hold every supplier to that one basis. GPUs per megawatt data center planning figures are meaningless across mixed denominators. A weak answer quotes a density without saying which megawatt it divides by.
2. Measure the site, not the forecast. Take the real heat-rejection delta and the available power from the existing plant. A weak answer reuses design conditions for a retrofit.
3. Set rack power target and redundancy topology, then derate. Compute usable capacity after derating before selecting hardware. A weak answer quotes nameplate capacity with no derating arithmetic.
4. Choose the thermal architecture and the zoning split. A weak answer proposes liquid cooling without stating which racks it covers.
5. Fix the module boundary and the interface list. A weak answer leaves the power-to-thermal interface undefined.
6. Require commissioning and maintenance access paths in writing. A weak answer describes access in prose but not in drawings.
7. Require monitoring coverage of the thermal and power path. A weak answer monitors power only.
Step | Evidence a supplier should provide | Failure signal |
|---|---|---|
1 | Stated denominator and basis | Density quoted without a denominator |
2 | Site measurements, not design assumptions | Forecast conditions reused |
3 | Derating calculation shown | Nameplate capacity only |
4 | Rack-by-rack thermal scope | Liquid cooling proposed generically |
5 | Interface list and boundary drawing | Interface left to the integrator |
6 | Commissioning checklist and access drawings | Access described only in prose |
7 | Thermal and power telemetry points | Power-only monitoring |
Next actions, all vendor-neutral: request a bill of materials tied to the assumptions you stated, ask for a commissioning checklist, and book a technical fit call to walk the derating arithmetic line by line.
Frequently Asked Questions
What does "tokens per megawatt" measure, and why does the denominator matter?
It measures delivered AI output against the power the facility actually draws, so the denominator decides how flattering the number looks. Vertiv’s definition of tokens per megawatt treats the megawatt as the constrained input and tokens as the output, which means a figure quoted against nameplate capacity and one quoted against metered draw are not comparable. For GPUs per megawatt data center planning, state whether the megawatt is contracted, provisioned, or measured at the meter before comparing two claims.
Are precision cooling and liquid cooling alternatives, or do they work together?
They work together, and treating them as a choice is the framing error that leads to undersized support infrastructure. The precision-versus-direct-to-chip distinction is often drawn by vendors with a portfolio on one side of it, so read the claim with that in mind. Room and row cooling handle the ambient load and the heat the liquid loop rejects; cold plates or immersion take the die-level flux air cannot move. The failure mode is a hall designed as if one replaces the other, with liquid loops installed and no plan for where the rejected heat goes.
Can an existing hall be retrofitted for high-density racks, or does it have to be rebuilt?
Many halls can be retrofitted, but the ceiling is set by air cooling, not by the racks you install. AFCOM’s analysis of the air-cooling ceiling frames the limit as a property of the cooling architecture rather than of the IT equipment. A retrofit usually succeeds when the constraint is power distribution, containment, or controls, and stalls when the room cannot move enough air across the density you need.
How much of a rack's power does the cooling support equipment consume?
It varies too widely to quote a single figure, and no verified source in this guide carries one. Cooling support draw depends on the heat-rejection path: a direct-to-chip loop adds pump and control power inside the rack envelope, while room-level cooling shifts that consumption to the facility and adds it back as fan and chiller load. The failure mode is a power budget that counts IT load only, then finds the support equipment competing for the same constrained megawatt.
Do integrated or modular approaches limit future flexibility?
They can, and the limit is usually contractual and physical rather than technical. A prefabricated block fixes the module boundary, the busway rating, and often the vendor for its subsystems, so changing any of those later means working within a defined envelope. That is a tradeoff rather than a defect: deployment speed and predictable commissioning in exchange for some freedom in how the block evolves. The failure mode is buying modular for speed and then planning a technology transition the module boundary cannot accommodate.
What does the pending ANSI/TIA-942-C Addendum 1 change for procurement?
It gives buyers a standards reference for AI-density facilities that did not previously exist, which matters most in specification language. The ANSI/TIA-942-C addendum on AI, targeted for mid-2027, is still pending, so treat any current claim of compliance as forward-looking rather than certified. Write requirements that name the addendum as the intended baseline and ask vendors to state where their design departs from it. Until it publishes, your specification carries the risk that the final text differs from the draft you planned against.
Conclusion
The comparable unit across every proposal you will receive is deliverable compute per constrained megawatt, and every figure in that proposal should trace back to a stated assumption about the denominator. That single test reorganizes the whole evaluation. Per-component metrics stop predicting density once rack power crosses the point where power, cooling and floor space interact. The derating chain, not the nameplate rating, is where the real answer lives. Architecture options then get judged against criteria you set in advance rather than against whichever specification sheet is longest, and the module boundary becomes a decision you make deliberately instead of a default you inherit.
What expires first is not the hardware. It is the assumptions. The standards landscape around high-density power and liquid cooling interfaces is still moving, and the reference figures suppliers quote today may rest on test conditions that no longer match your deployment.
So close the loop on your own terms: request the bill of materials and the commissioning checklist, and ask that each capacity, efficiency and density number be returned against the assumptions you supplied.