Table of Contents
ToggleKey takeaways
A defensible five-year TCO for GPU racks (direct-to-chip) starts with a clear system boundary and a baseline you can defend, then separates one-time CAPEX from annual OPEX with tariff logic.
At row/pod scale (8–16 racks), results are usually driven by (1) what fan power you can actually retire, (2) demand charges and peak coincidence, and (3) how you scope redundancy + commissioning.
Use sensitivity analysis to keep arguments honest. If payback only works in one perfect scenario, it’s not a business case.
(Primary keyword variants used in-body: direct-to-chip liquid cooling TCO, liquid cooling ROI.)
1) Define the decision: what “five-year TCO” should include for a GPU pod
Most liquid-cooling ROI discussions fail because they compare a single quote to a single savings assumption.
For procurement-grade decisions, define three things up front:
The unit of analysis: in this guide we use a GPU pod (8–16 racks) because that’s how projects are budgeted and phased.
The boundary: what sits inside your cost model vs what you treat as “facility shared infrastructure.”
The tariff model: energy charges are not the same as demand charges.
A simple, defensible structure:
5-year TCO (undiscounted) = CAPEX + 5 × annual OPEX
5-year NPV TCO (optional) = CAPEX + Σ (annual OPEX ÷ (1+r)^t)
Where annual OPEX includes energy, maintenance, consumables, and any recurring service.
Key Takeaway: The “right” model is the one a skeptical facilities leader and a skeptical procurement lead will both sign.
2) Establish the baseline: air-cooled GPU pod cost model (what you must measure)
If your baseline is vague, your savings will be imaginary.
2.1 Baseline inputs (minimum viable)
For an 8–16 rack pod, capture (or estimate with measurement windows):
IT load profile: average kW and peak kW at the pod boundary (not nameplate only)
Server fan power baseline: measured per server or inferred from server telemetry
Room cooling power attributed to the pod: CRAH/CRAC, pumps, and chiller share (use your internal allocation method)
Ops costs driven by density: hot-spot response, airflow balancing, containment fixes, change windows
2.2 Baseline traps that break ROI math
Double-counting savings: if your PUE model already captures cooling power, don’t also subtract “fan savings” from the same bucket.
Assuming perfect utilization: AI pods often run bursty. Use a utilization factor rather than assuming 100% load.
Ignoring peak coincidence: demand-charge savings only materialize if your kW reduction occurs during peak billing windows.
3) Direct-to-chip at row/pod scale: what you’re actually buying
Direct-to-chip (DTC) isn’t “a cold plate.” It’s a distribution, controls, and risk-management system that has to behave predictably under change (swapped servers, changing loads, partial deployment).
A practical system view:
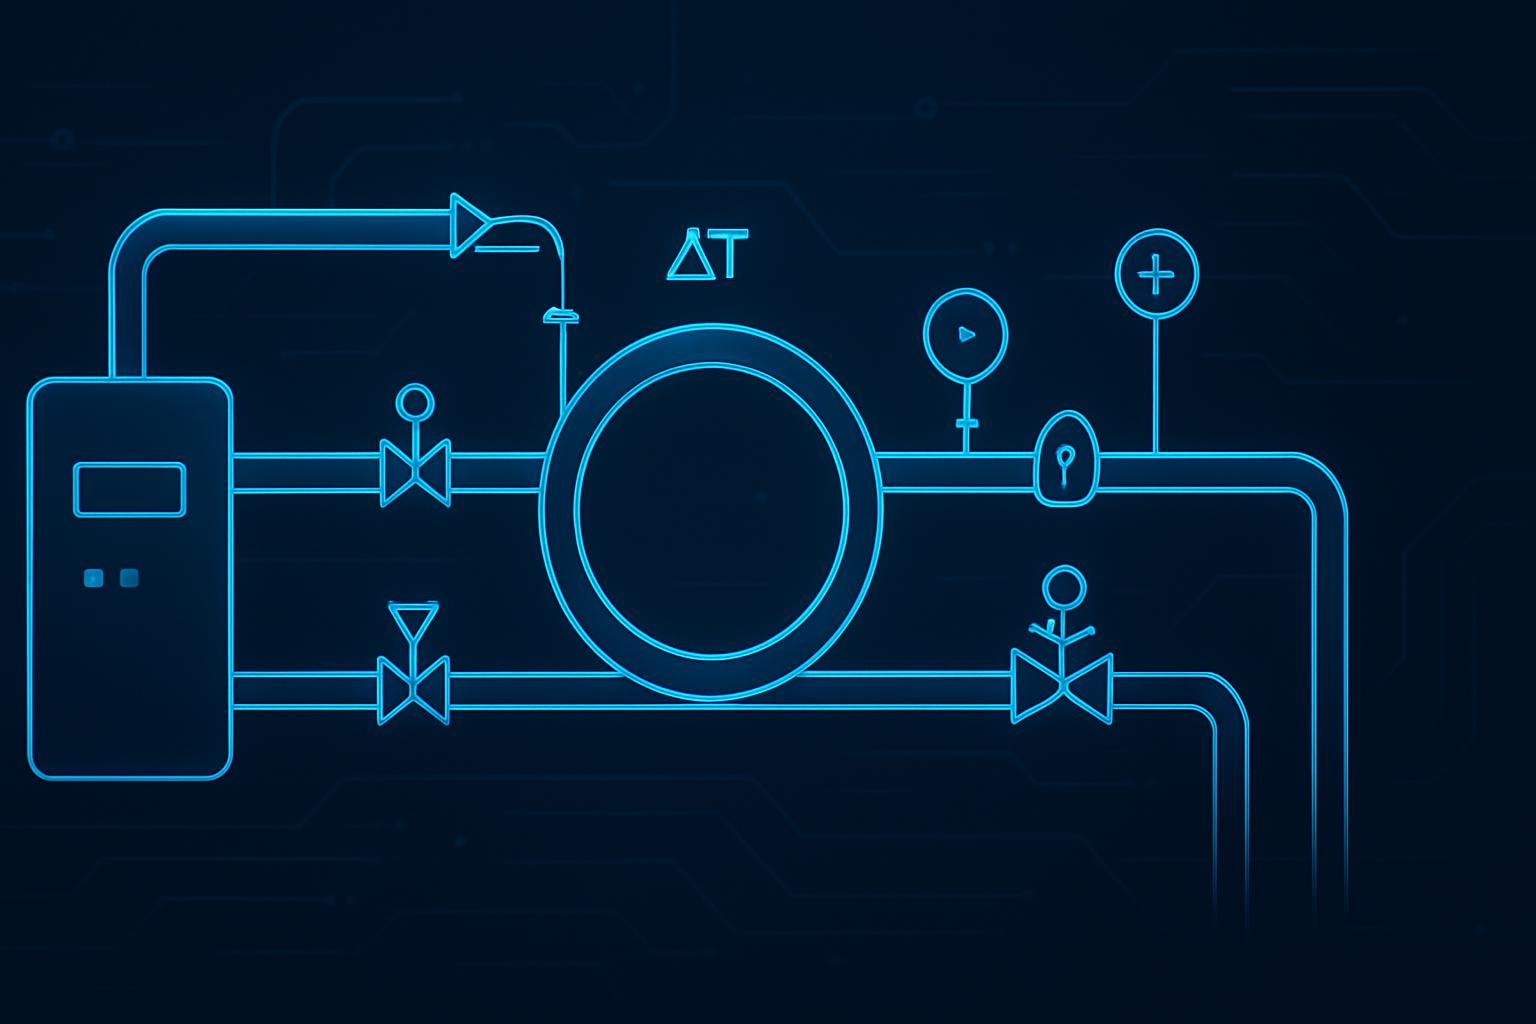
Primary loop (facility side): building heat-rejection loop (chilled water, warm water, or another plant approach)
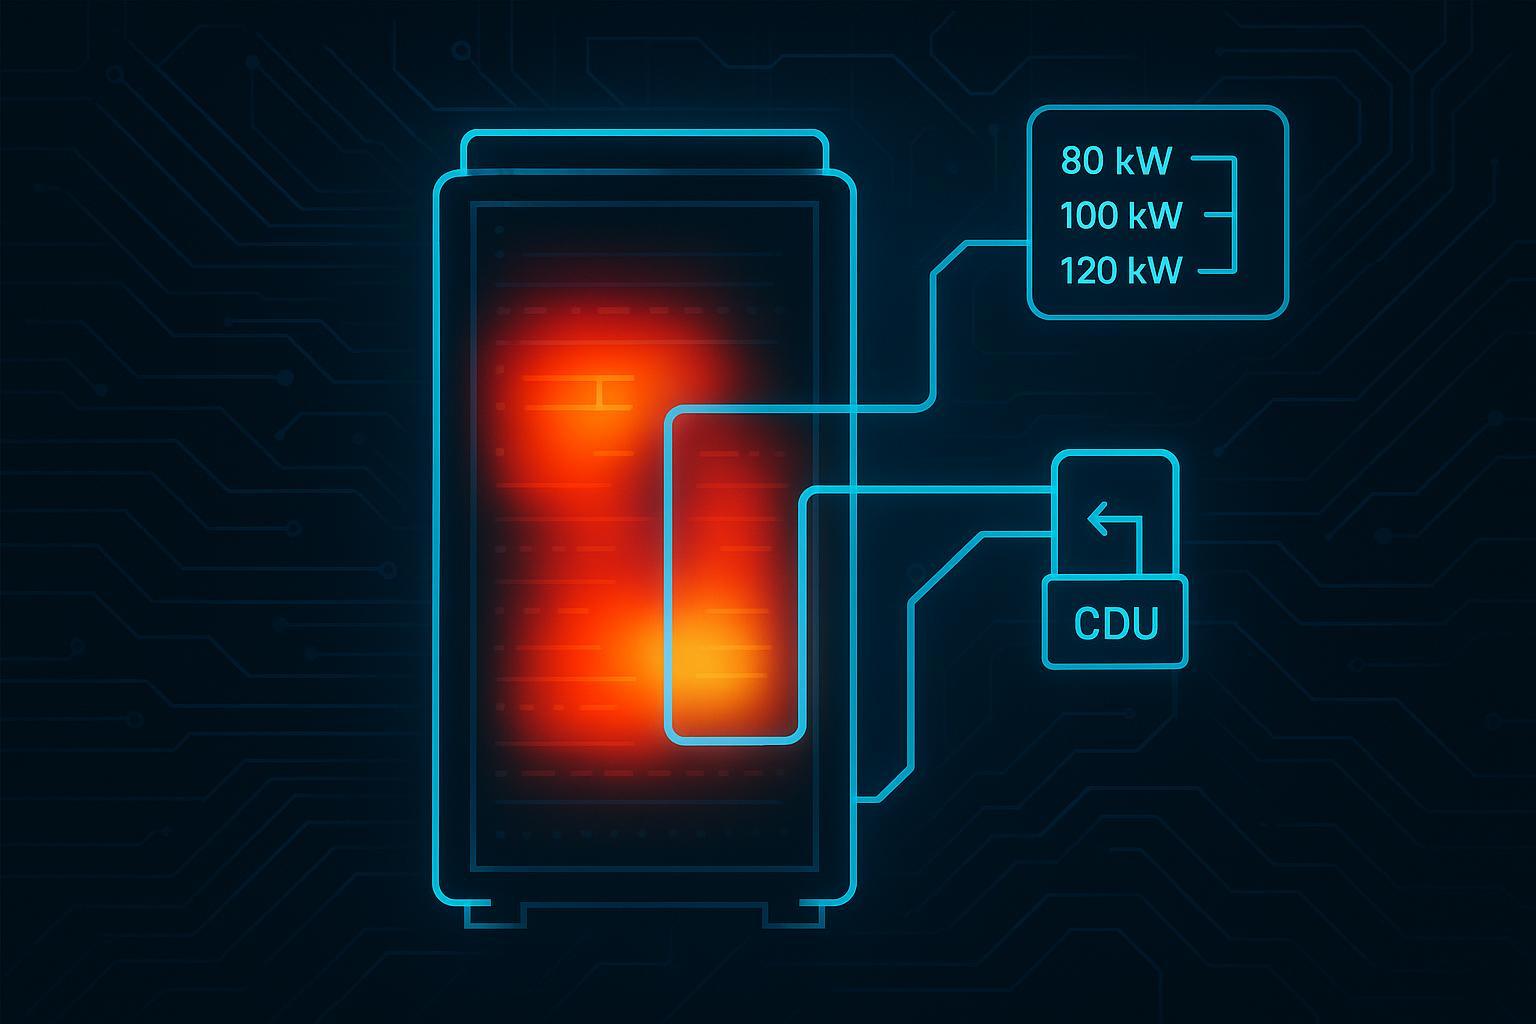
Secondary loop (technology cooling): pumps + heat exchanger + controls → supply/return headers → branch lines → rack manifolds → server cold plates → return
An operator-focused description of loops, CDUs, rack manifolds, and leak detection is laid out in Equinix’s 2026 explainer on the anatomy of a direct-to-chip liquid cooling system.
If your team needs a component primer, Coolnetpower’s internal overview of direct-to-chip liquid cooling with cold plates is a helpful starting point.
4) CAPEX model: CDUs, manifolds, piping, and the costs people forget
A clean CAPEX model should be line-itemed, not bundled. Below is a template you can adapt.
4.1 CAPEX line-item template (row/pod)
CAPEX bucket | Typical line items | Units | Scope notes |
|---|---|---|---|
CDUs | CDU(s), pumps, plate heat exchanger, controls, filtration | per CDU | Decide redundancy target (N, N+1). Clarify monitoring and alarms |
Distribution | supply/return headers, rack manifolds, quick disconnects, hoses | per rack + per pod | Define ownership boundary and spares (couplings, valves, sensors) |
Piping & valves | secondary loop piping, isolation valves, supports, balancing/control valves | per meter/foot + per pod | Route complexity matters more than per-rack averages |
Leak detection & safety | leak cable/spot sensors, drip trays, automatic shutoff valves (if used) | per pod | Make detection + response explicit (not implied) |
Commissioning | flushing, pressure test, controls integration, balancing, training | per pod | Often the difference between “works on day 1” and “works in month 6” |
Retrofit enabling works (if retrofit) | rack mods, change windows, temporary cooling, remediation | per site | Keep separate so retrofit vs greenfield comparisons stay fair |
4.2 CDU sizing and redundancy (why it belongs in the TCO model)
Even if you’re not designing the loop yourself, the inputs that drive CDU sizing are procurement inputs:
design load (kW) and expected growth
target ΔT and supply temperature
redundancy target and allowable failure behavior
monitoring scope and integration into DCIM/BMS
If you want a structured checklist, use Coolnetpower’s guide on how to size a CDU for AI data centers step by step to align stakeholders on required inputs before quotes arrive.
4.3 CAPEX scoping rules that prevent surprises
State the density target and whether you’re sizing for today or the next GPU refresh.
Make redundancy explicit: pumps, power feeds, controls, and “what happens if a CDU is down?”
Document the ownership boundary (often at rack quick disconnects). This affects spares, training, and service responsibilities.
⚠️ Warning: If piping routes and isolation plans aren’t scoped, your model will understate retrofit cost and overstate deployment speed.
5) OPEX model: fan energy removed vs pump energy added (plus maintenance)
The two most common modeling errors are:
assuming you retire all fan power, and
ignoring pump power and maintenance.
5.1 Fan energy savings (baseline → DTC)
Model fan savings as a factor applied to a baseline you can defend.
Baseline annual fan energy (kWh/year):
average fan kW × 8,760 × utilization factor
DTC annual fan energy:
baseline × (1 − fan_reduction_fraction)
Annual savings:
kWh saved × $/kWh
Be conservative: even with DTC, some airflow may remain necessary for non-liquid-cooled components.
5.2 Added pump energy (CDU + distribution)
Add pump energy explicitly rather than burying it.
annual pump energy (kWh/year) = pump kW × 8,760 × utilization factor
If you don’t have pump kW during early-stage budgeting, use a range and let sensitivity analysis show whether it matters.
5.3 Maintenance: make it auditable
A practical way to keep this procurement-friendly is to model an annual “O&M allowance” that covers:
filters and coolant quality management (where applicable)
sensor checks and calibration
periodic inspection of couplings and valves
training refresh and leak-response drills
This also makes it easier to compare to alternatives (RDHx and immersion have different labor profiles, even if they’re all “liquid”).
For a general overview of DTC system considerations (including CDU variants and deployment topics), see Vertiv’s 2024 deep dive on direct-to-chip cooling in HPC infrastructure.
6) Tariffs that can flip the answer: energy, demand charges, escalation
For multi-region organizations, the safest approach is to treat tariffs as inputs with scenario bands rather than argue about one “correct” rate.
6.1 Separate energy and demand charges
Model two components:
Energy charge: $/kWh × kWh saved
Demand charge (where applicable): $/kW-month × kW reduced at peak × 12
This is why “kWh savings” can look impressive but pay back slowly at one site—and pay back quickly at another.
6.2 A tariff input block you can reuse (US/EU/MEA/APAC)
Instead of asserting exact rates, build an input block.
Region | Energy charge ($/kWh) | Demand charge ($/kW-month) | Notes |
|---|---|---|---|
US | low / base / high | low / base / high | In some territories, demand charges dominate the economics |
EU | low / base / high | low / base / high | Contract structure and volatility matter; confirm hedging terms |
MEA | low / base / high | low / base / high | Site-specific; confirm subsidies and plant constraints |
APAC | low / base / high | low / base / high | Time-of-use can materially change payback |
If you want an external, non-vendor perspective on why cooling architecture and “warm water” matter to energy outcomes, the LBNL Data Center Efficiency Center maintains an overview page on liquid cooling.
7) Sensitivity analysis: which assumptions drive five-year TCO and payback
A good sensitivity section does two jobs:
tells decision-makers what to debate
tells engineers what to measure
7.1 One-way sensitivity (tornado-ready variables)
Rank these by impact in your spreadsheet:
energy price ($/kWh)
demand charge ($/kW-month)
fan_reduction_fraction (how much fan power you can actually retire)
CDU + distribution CAPEX
retrofit enabling works CAPEX (if brownfield)
pump kW (CDU + distribution)
annual maintenance allowance
utilization factor (how steady the AI load is)
7.2 Scenario sets that match real GPU pod behavior
Run at least three:
Conservative: smaller fan reduction, higher retrofit cost, lower utilization
Base: best estimate
High tariff exposure: demand-charge-heavy or TOU-heavy; use the same technical assumptions
Pro Tip: If your finance team won’t accept an “optimistic” case, don’t argue—rename it by condition (“high utilization / high tariff exposure”). The point is to reveal dependence.
8) Direct-to-chip vs RDHx vs immersion: where each wins (high-level)
This section is intentionally high-level. Your goal is to identify which architecture deserves detailed design effort.
For an internal orientation, Coolnetpower provides a comparison primer: direct-to-chip vs immersion vs rear-door heat exchanger compared.
8.1 Comparison matrix (what changes your TCO inputs)
Dimension | RDHx | Direct-to-chip (DTC) | Immersion |
|---|---|---|---|
Retrofit disruption | Lower (no server mods) | Medium–high (server loop integration) | High (ops + layout changes) |
Where CAPEX concentrates | rack doors + facility water routing | CDU(s) + secondary loop + rack manifolds | tanks + fluid handling + CDU/HX |
Biggest OPEX drivers | partial fan and room cooling reduction | fan reduction + pump power + maintenance | high heat capture; different maintenance model |
Ops model shift | Moderate | Moderate–high | High |
When it’s a strong fit | density uplift without changing servers | sustained high-density GPU pods | greenfield / extreme density / dedicated ops workflows |
If your near-term decision is “RDHx now vs DTC now,” Coolnetpower’s overview of RDHx vs direct-to-chip for 30–80 kW racks: how to choose can help structure evaluation criteria.
9) A buildable template: the 5-year TCO table you can paste into your spreadsheet
Below is a deliberately simple table layout. The goal is to give you a model structure that survives scrutiny.
9.1 TCO line item table (template)
Category | Line item | Year 0 (CAPEX) | Annual (OPEX) | Notes / assumptions |
|---|---|---|---|---|
CAPEX | CDU(s) |
|
| quantity, redundancy level, included monitoring |
CAPEX | Rack manifolds + QDs + hoses |
|
| per rack + spare couplings |
CAPEX | Secondary piping + valves |
|
| route length, isolation plan |
CAPEX | Leak detection + safety |
|
| sensor coverage + response plan |
CAPEX | Commissioning + training |
|
| flush/test/balance + runbooks |
OPEX | Energy: fan kWh removed |
|
| baseline fan kW × reduction fraction |
OPEX | Energy: pump kWh added |
|
| pump kW × utilization |
OPEX | Maintenance allowance |
|
| filters, checks, calibration |
OPEX | Spares allowance |
|
| couplings, sensors, small valves |
9.2 Payback and NPV (optional)
Annual net savings = (baseline OPEX − new OPEX)
Simple payback = CAPEX ÷ annual net savings
NPV = Σ (annual net savings ÷ (1+r)^t) − CAPEX
10) Procurement checklist: questions that protect SLA, auditability, and change control
Use these to keep your TCO model tied to real delivery scope.
10.1 Scope and responsibility
Where is the responsibility boundary (at quick disconnects, at the CDU, elsewhere)?
Who owns coolant quality management and what monitoring is included?
What redundancy is included (pumps, power feeds, controls) and what is the failover behavior?
10.2 Design and commissioning
What facility-side water temperature range is assumed?
What ΔT and flow are assumed on the secondary loop?
What is the commissioning plan (flush, pressure test, leak detection validation, alarm runbooks)?
10.3 O&M readiness
What spares are recommended (couplings, valves, sensors, pump components)?
What training is included and what are the runbooks for leak response?
10.4 Cost transparency
Provide CAPEX broken down by CDU(s), manifolds/distribution, piping/valves, leak detection, commissioning.
Provide OPEX assumptions: pump kW, maintenance visits/year, consumables.
FAQ: common business-case questions
What’s the TCO of direct-to-chip retrofits over five years?
It depends mainly on your baseline (fan power + room cooling), retrofit enabling works (piping routes and change windows), and tariff structure. A model that explicitly separates CAPEX from annual OPEX—and treats demand charges separately—is usually sufficient to compare options without pretending there is one universal number.
What CAPEX should we expect for CDUs, manifolds, and piping?
Treat CDU(s), distribution/manifolds, and secondary piping/valves as separate line items, and insist on commissioning as a scoped deliverable. If any quote collapses these into a single “system price,” you lose the ability to validate assumptions and compare vendors fairly.
Where does OPEX improvement usually come from?
Typically from reduced server fan energy and reduced reliance on room-level airflow for the pod (while adding pumping energy and a different maintenance profile). Exact outcomes depend on the fraction of heat captured and how the facility loop rejects heat.
Next steps
Build your baseline with measurement windows (fan power and peak kW matter more than perfect precision).
Fill in the TCO table template, then run sensitivity on the three assumptions your engineering lead distrusts most.
If you’re evaluating vendors, start with a neutral component overview like Coolnetpower’s liquid cooling solutions to align on common building blocks and interfaces.
If you want to pressure-test your draft inputs, Coolnetpower can review your scope assumptions (piping route, redundancy level, commissioning plan) and flag the places where projects typically drift.